What is HappySignals?
HappySignals IT Experience Management Platform enables enterprises to Measure end-user experiences, Share experience data, Identify focus areas, and Improve what matters most to make employees happier and more productive with IT.
For IT professionals, HappySignals is the single platform for you to put IT Experience Management (ITXM™) into practice. More smiles and less time wasted – for you and your end-users.
Navigating HappySignals
HappySignals Platform has five main sections: Dashboard, Measure, Share, Identify, and Improve. Some sections include multiple pages, such as Identify and Improve.
 Skip ahead to:
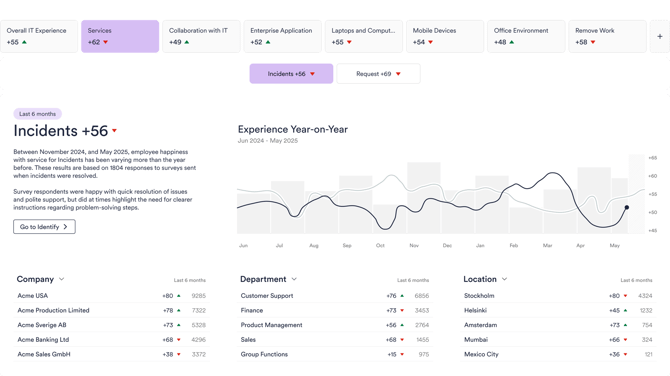
1. Dashboard
- How is IT performing across the Measurement Areas?
- What is important for users in this Measurement Area?
- Where should we focus next?
Learn more about using Dashboard
2. Measure
- Drill down into response data for different areas using the selectors and filter search bar at the top of the page. Select specific Measurement Areas, ticket types, filters, or Shortcuts to look at, depending on your focus area.
- Understand how response rates and volumes have developed over time by selecting the time period you want to look at.
- The Measured Experiences graph visualizes the breakdown of response volume and response rate for different measurement areas each week. Hover on the graph to see the response data in a particular week.
- Click on any Measurement Area card under the graph for more details about your measurement activities and responses.
Learn more about using the Measure page
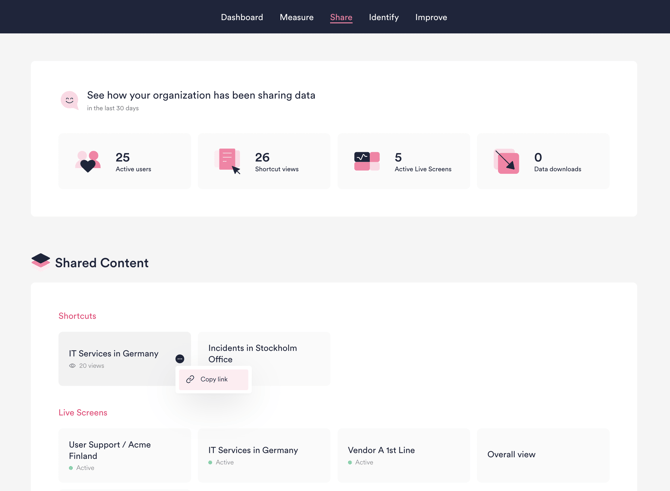
3. Share
- Understand how (or whether) your organization has been sharing data.
- Easily access all Shared Content in one click, or copy a link to share them with your colleagues.
4. Identify
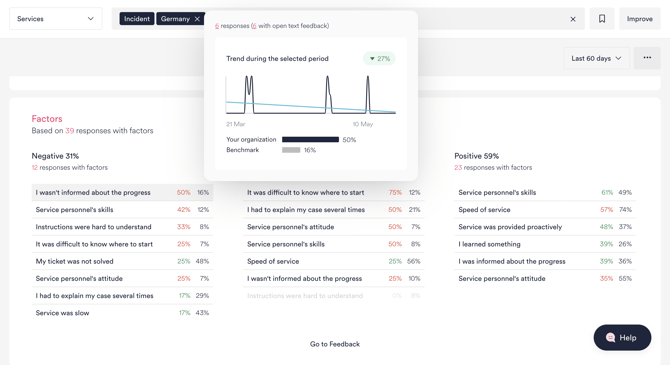
Experience
On the Experience page, drill down to identify the most critical areas for improvement:
- See Happiness and Lost time for different countries, services, vendors, etc.
- Drill down into your data by selecting one or more titles to apply them as filters.
- On the graph, notice any significant dips or peaks in Happiness and Lost time and check if targets are being met.
- No need to spend time building custom reports! Simply share real-time data by showing the Experience page in meetings with colleagues and stakeholders.
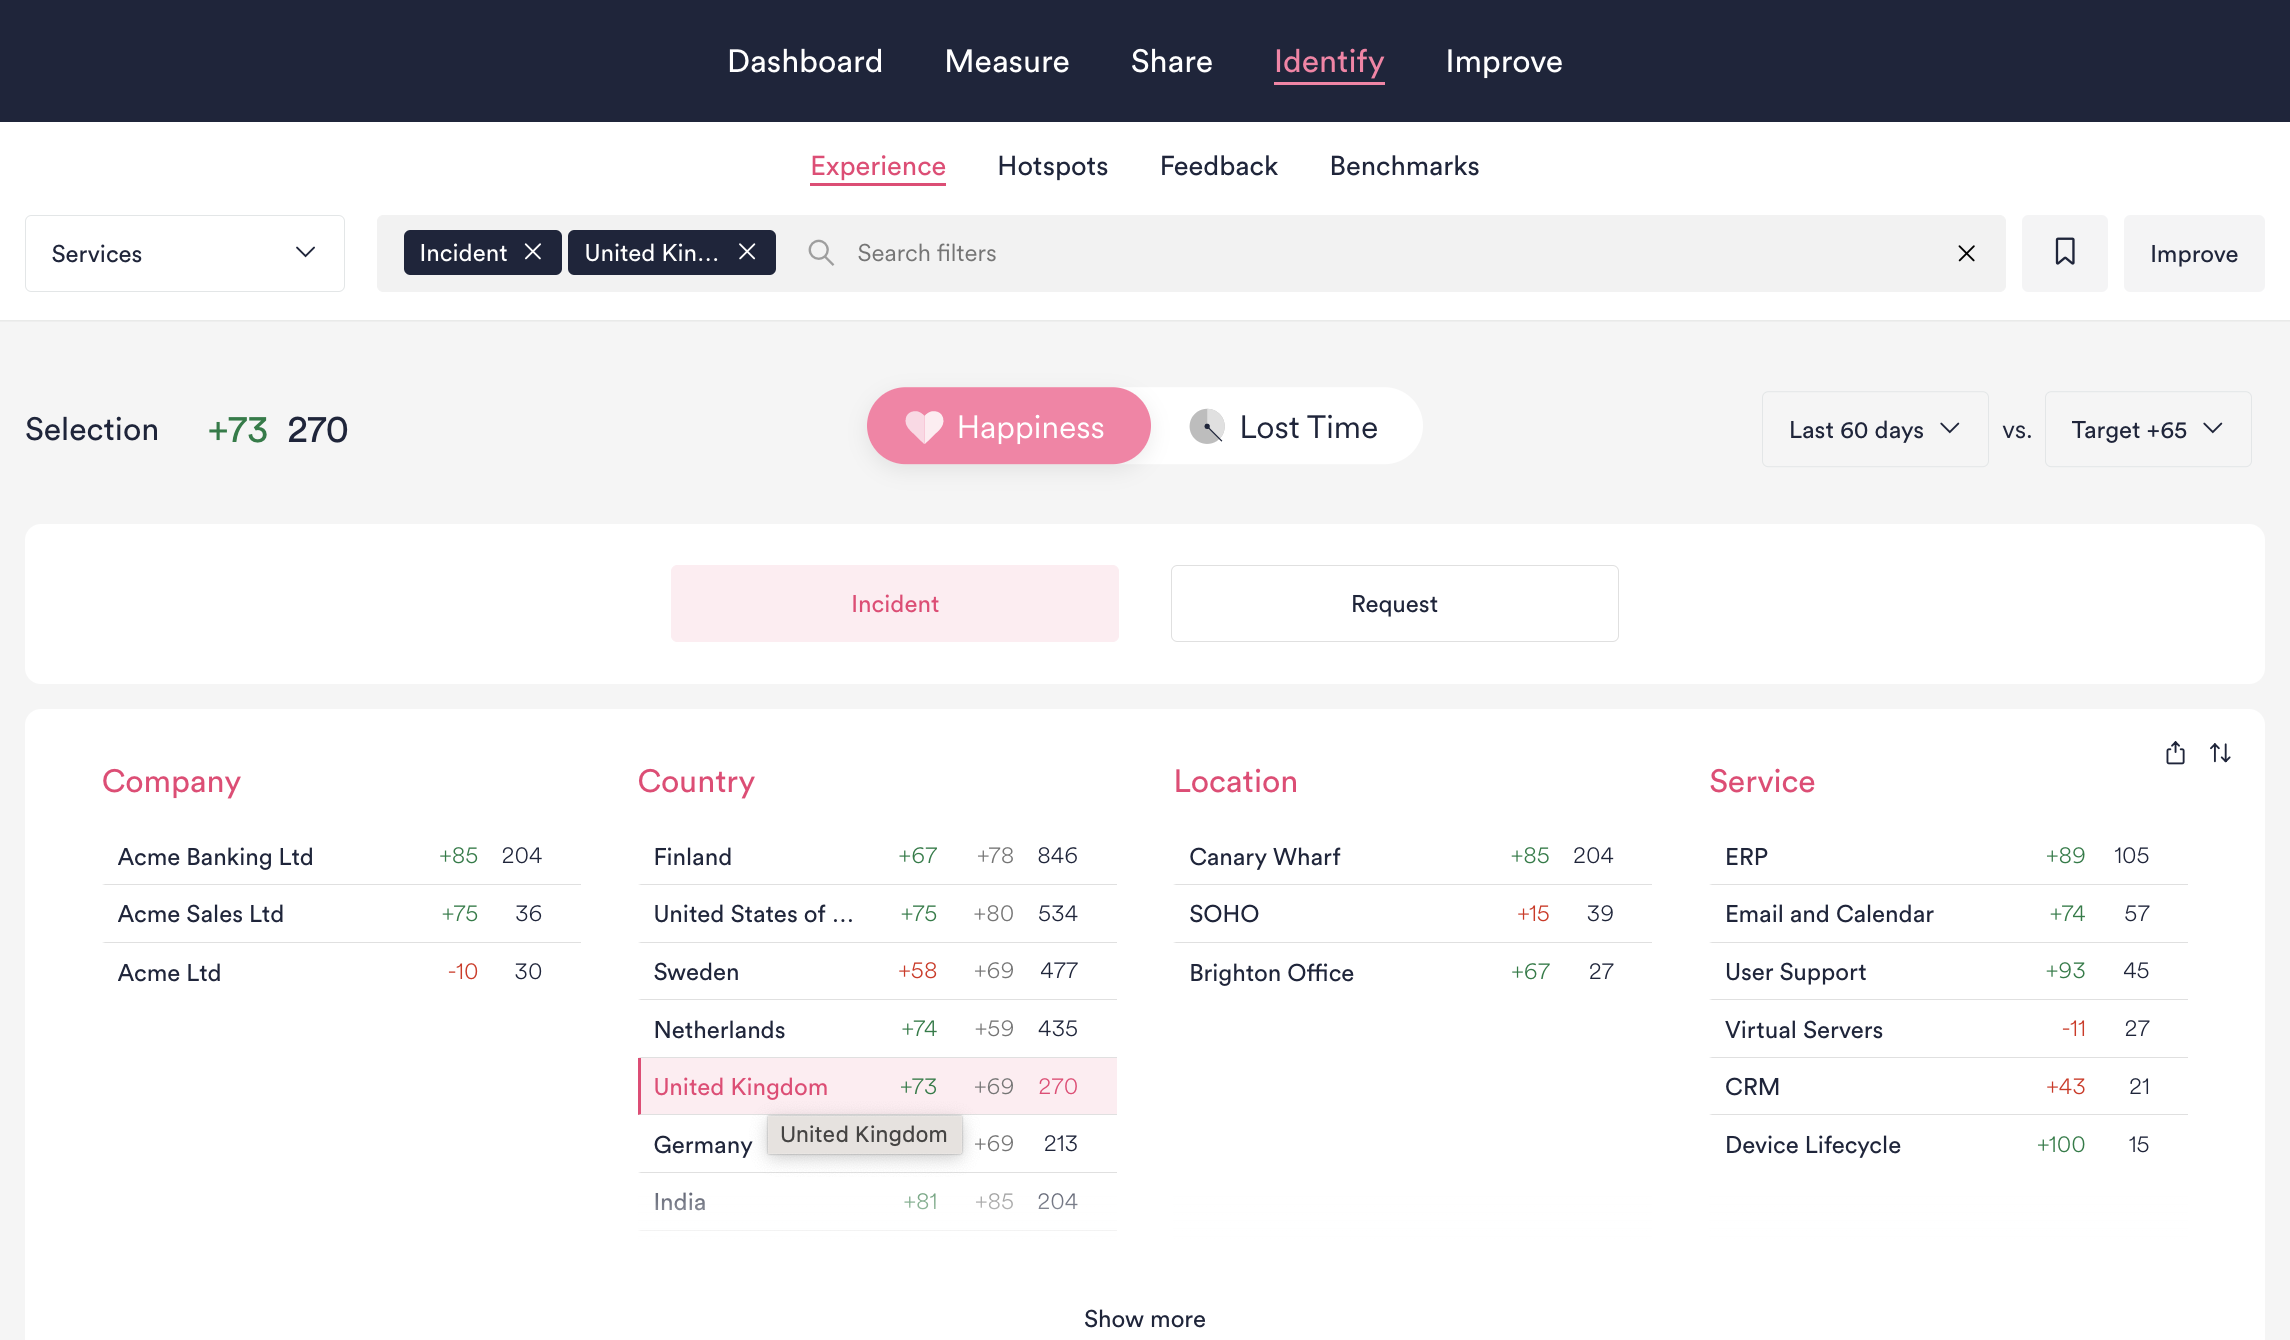
- Save filters as a Shortcut by clicking the bookmark icon. Share a shortcut link to others who should follow the same data.
- Create an Initiative or make an XLA for the filtered area by clicking the Improve button.
Learn more about using Experience
Hotspots
The Hotspots page is where you can create heat maps to expose hidden experience gaps from your data.
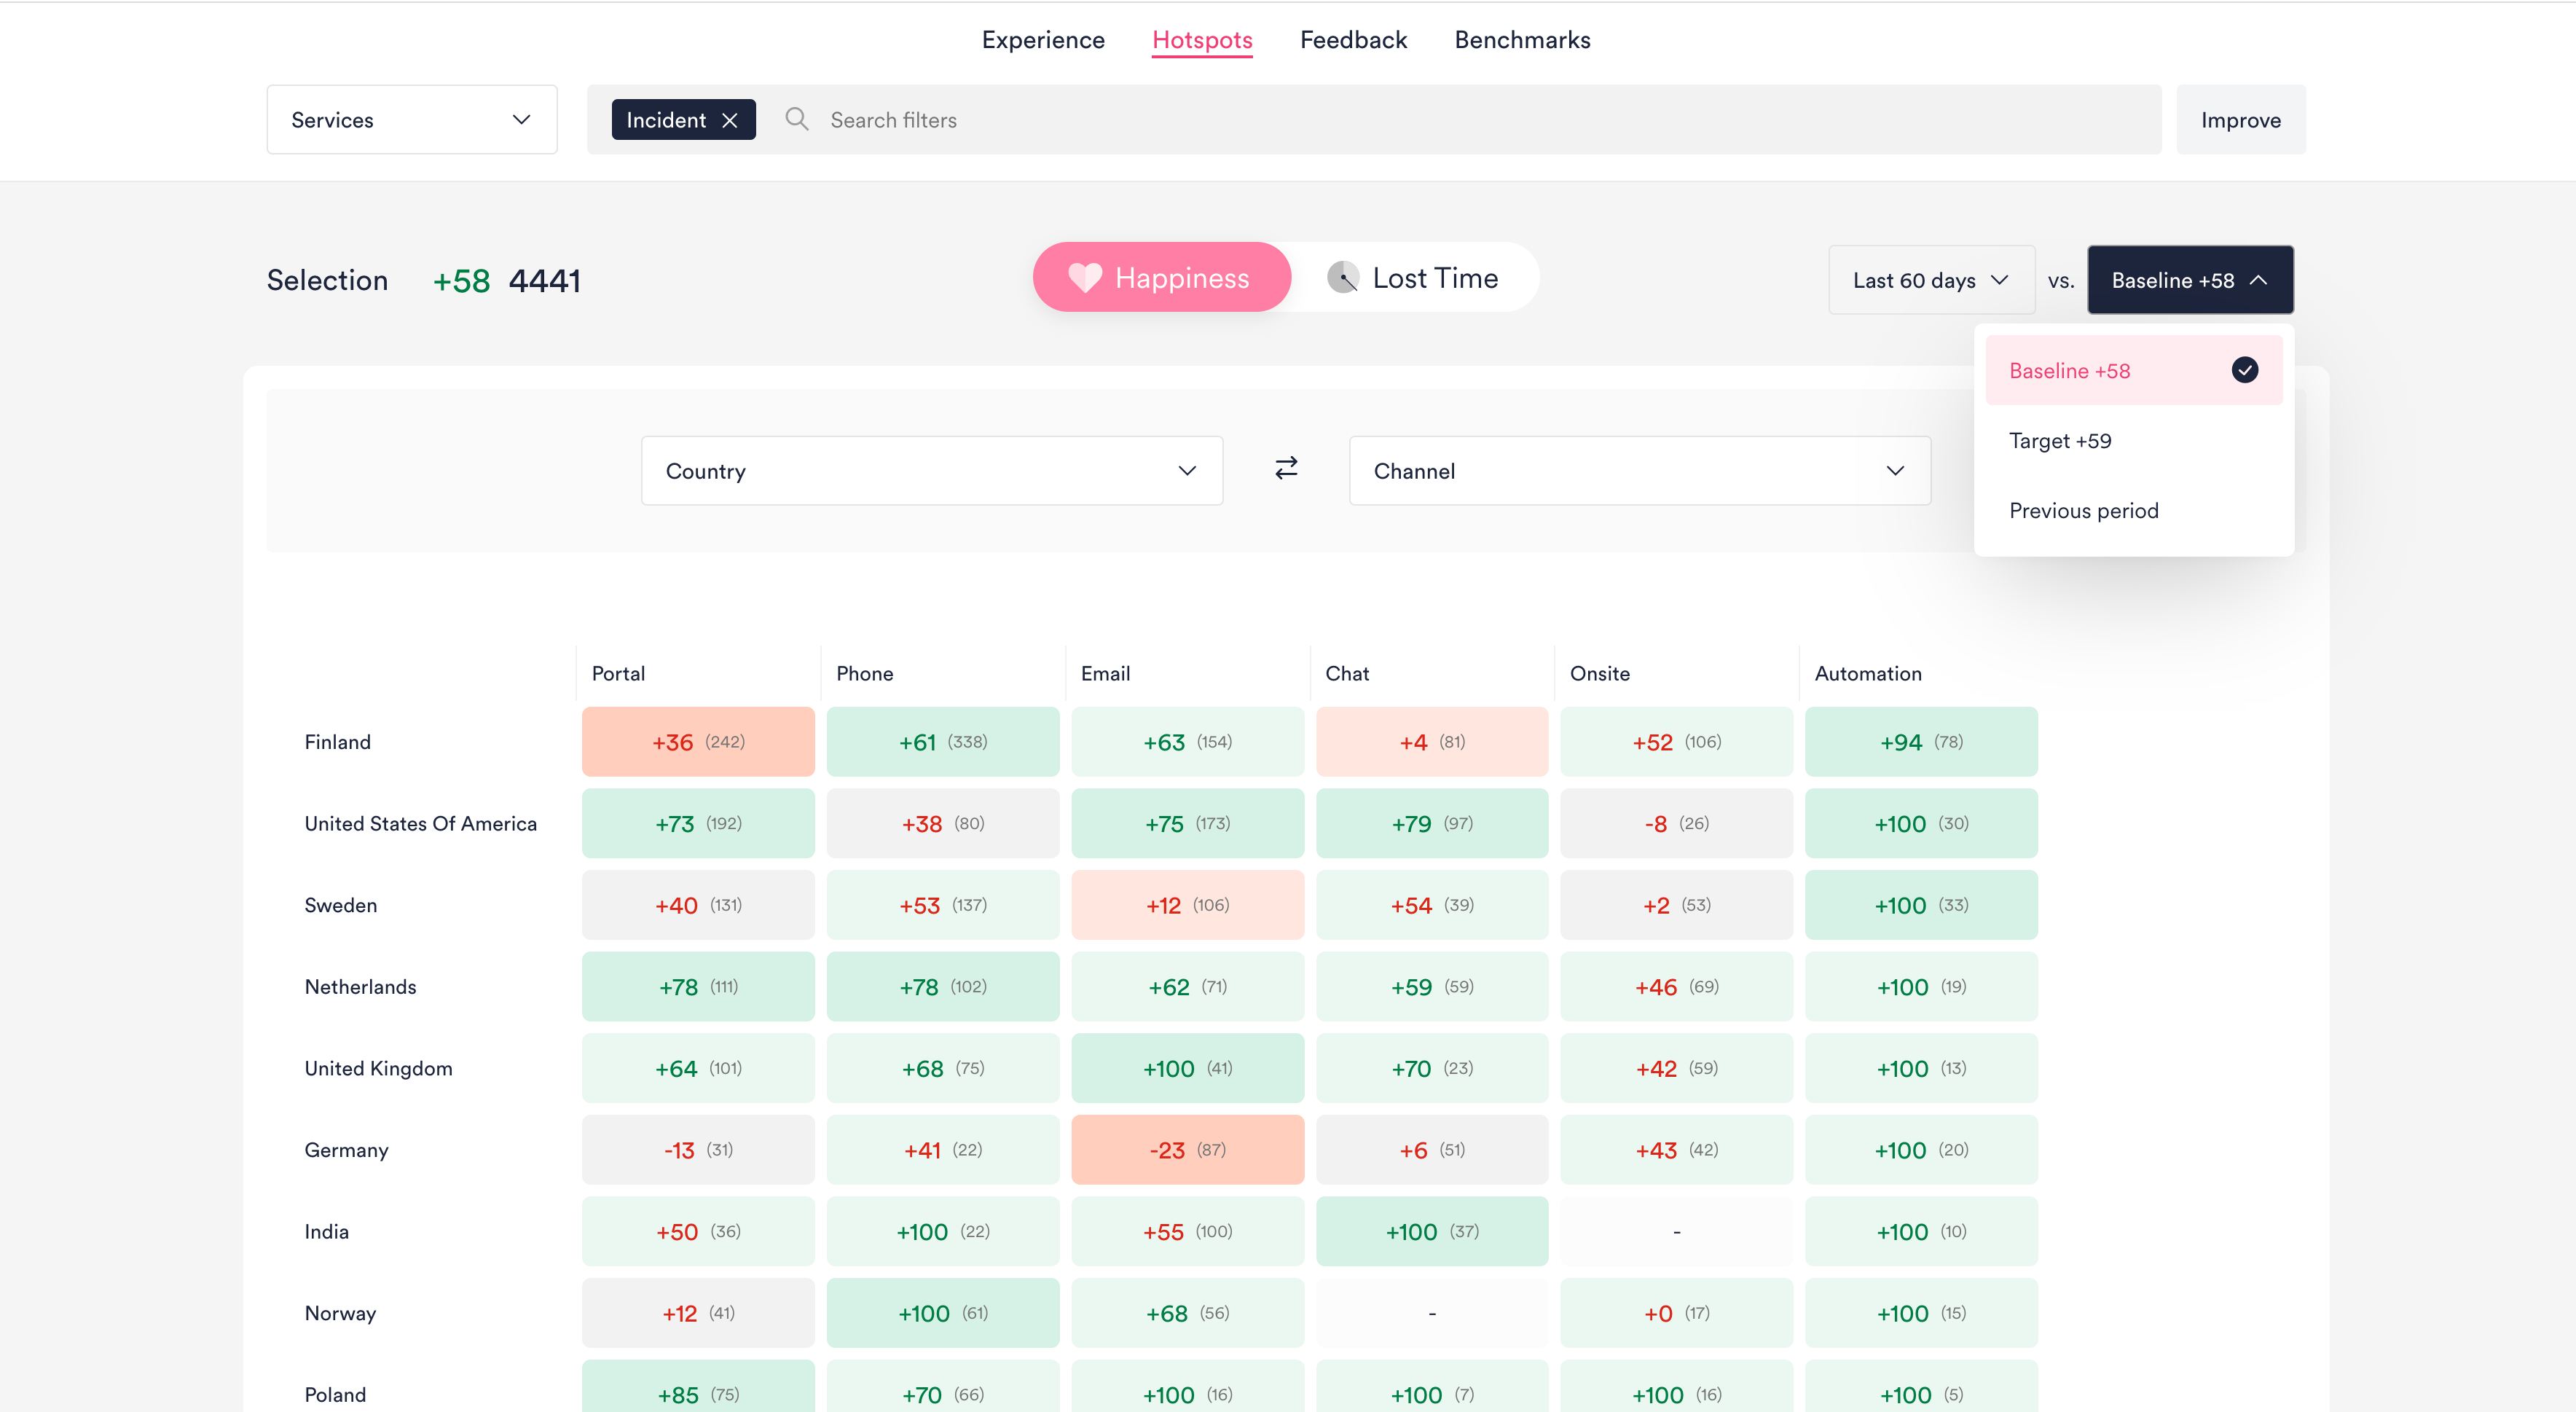
Learn more about using Hotspots
Feedback
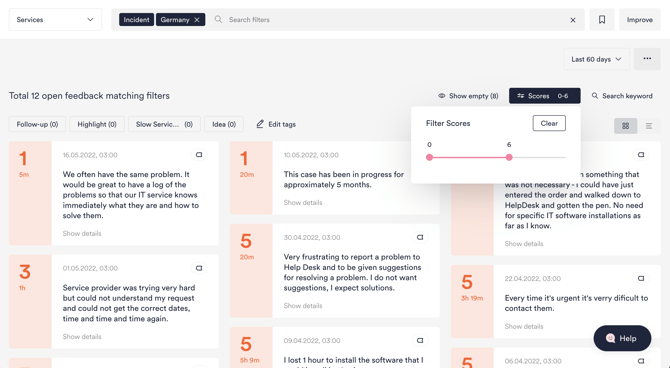
Tag feedback with “Follow-up”, “Highlight” or “Idea”, or a custom tag. Easily return to your tagged feedback later.
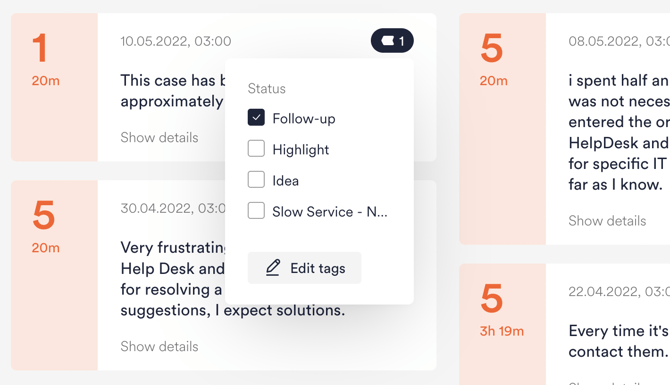
Learn more about using Feedback
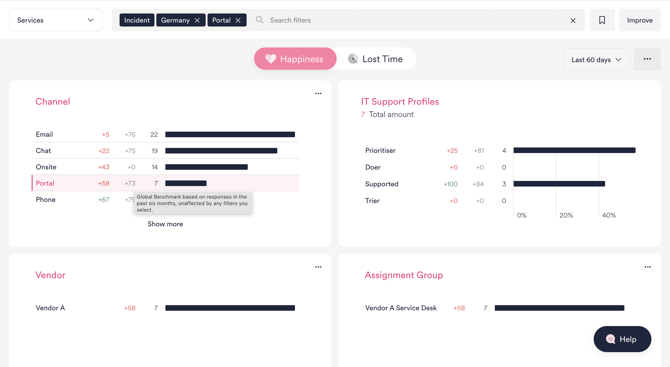
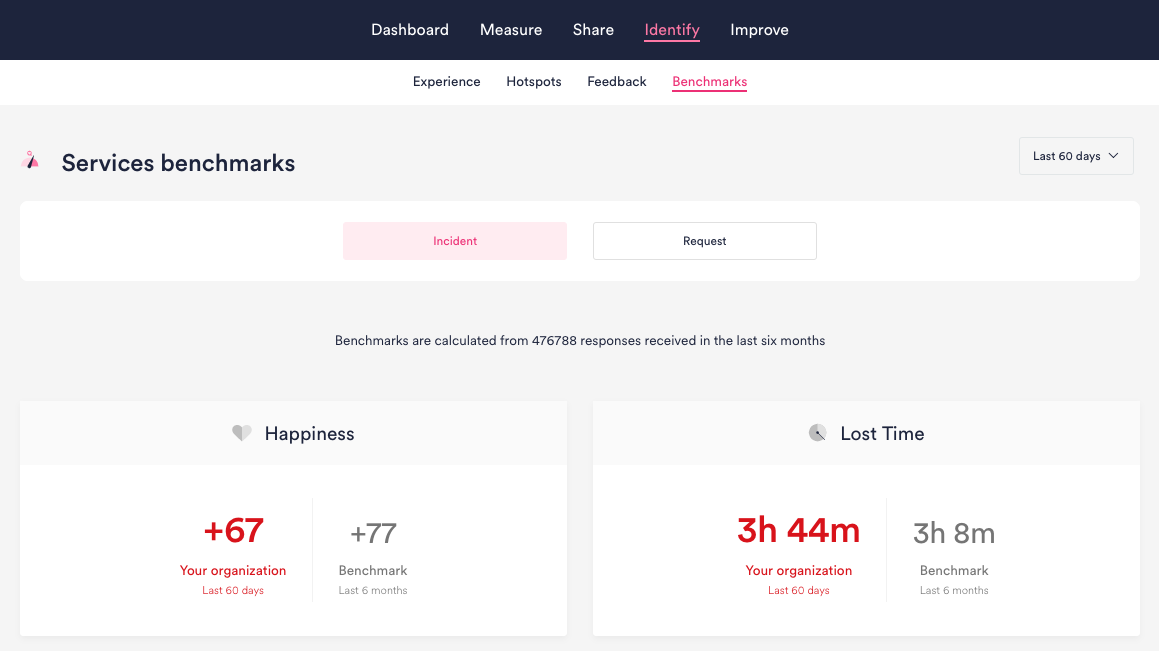
Benchmarks
- Compare overall Happiness and Lost time with IT Services in your organization with Global Benchmarks (calculated based on all organizations that use HappySignals).
- See how your end-users with different IT Support Profiles experience IT differently in your organization. Read more about HappySignals’ IT Support Profiles.
- Compare your end-users’ Happiness and Lost time in different countries with Country-specific Benchmarks. Account for cultural differences in rating behavior since, for example, Happiness of +80 may be over benchmark in Finland but under benchmark in Brazil.
Learn more about using Benchmarks
5. Improve
Under Improve, you’ll find four pages: Overview, Objectives, Targets, and Improvements.
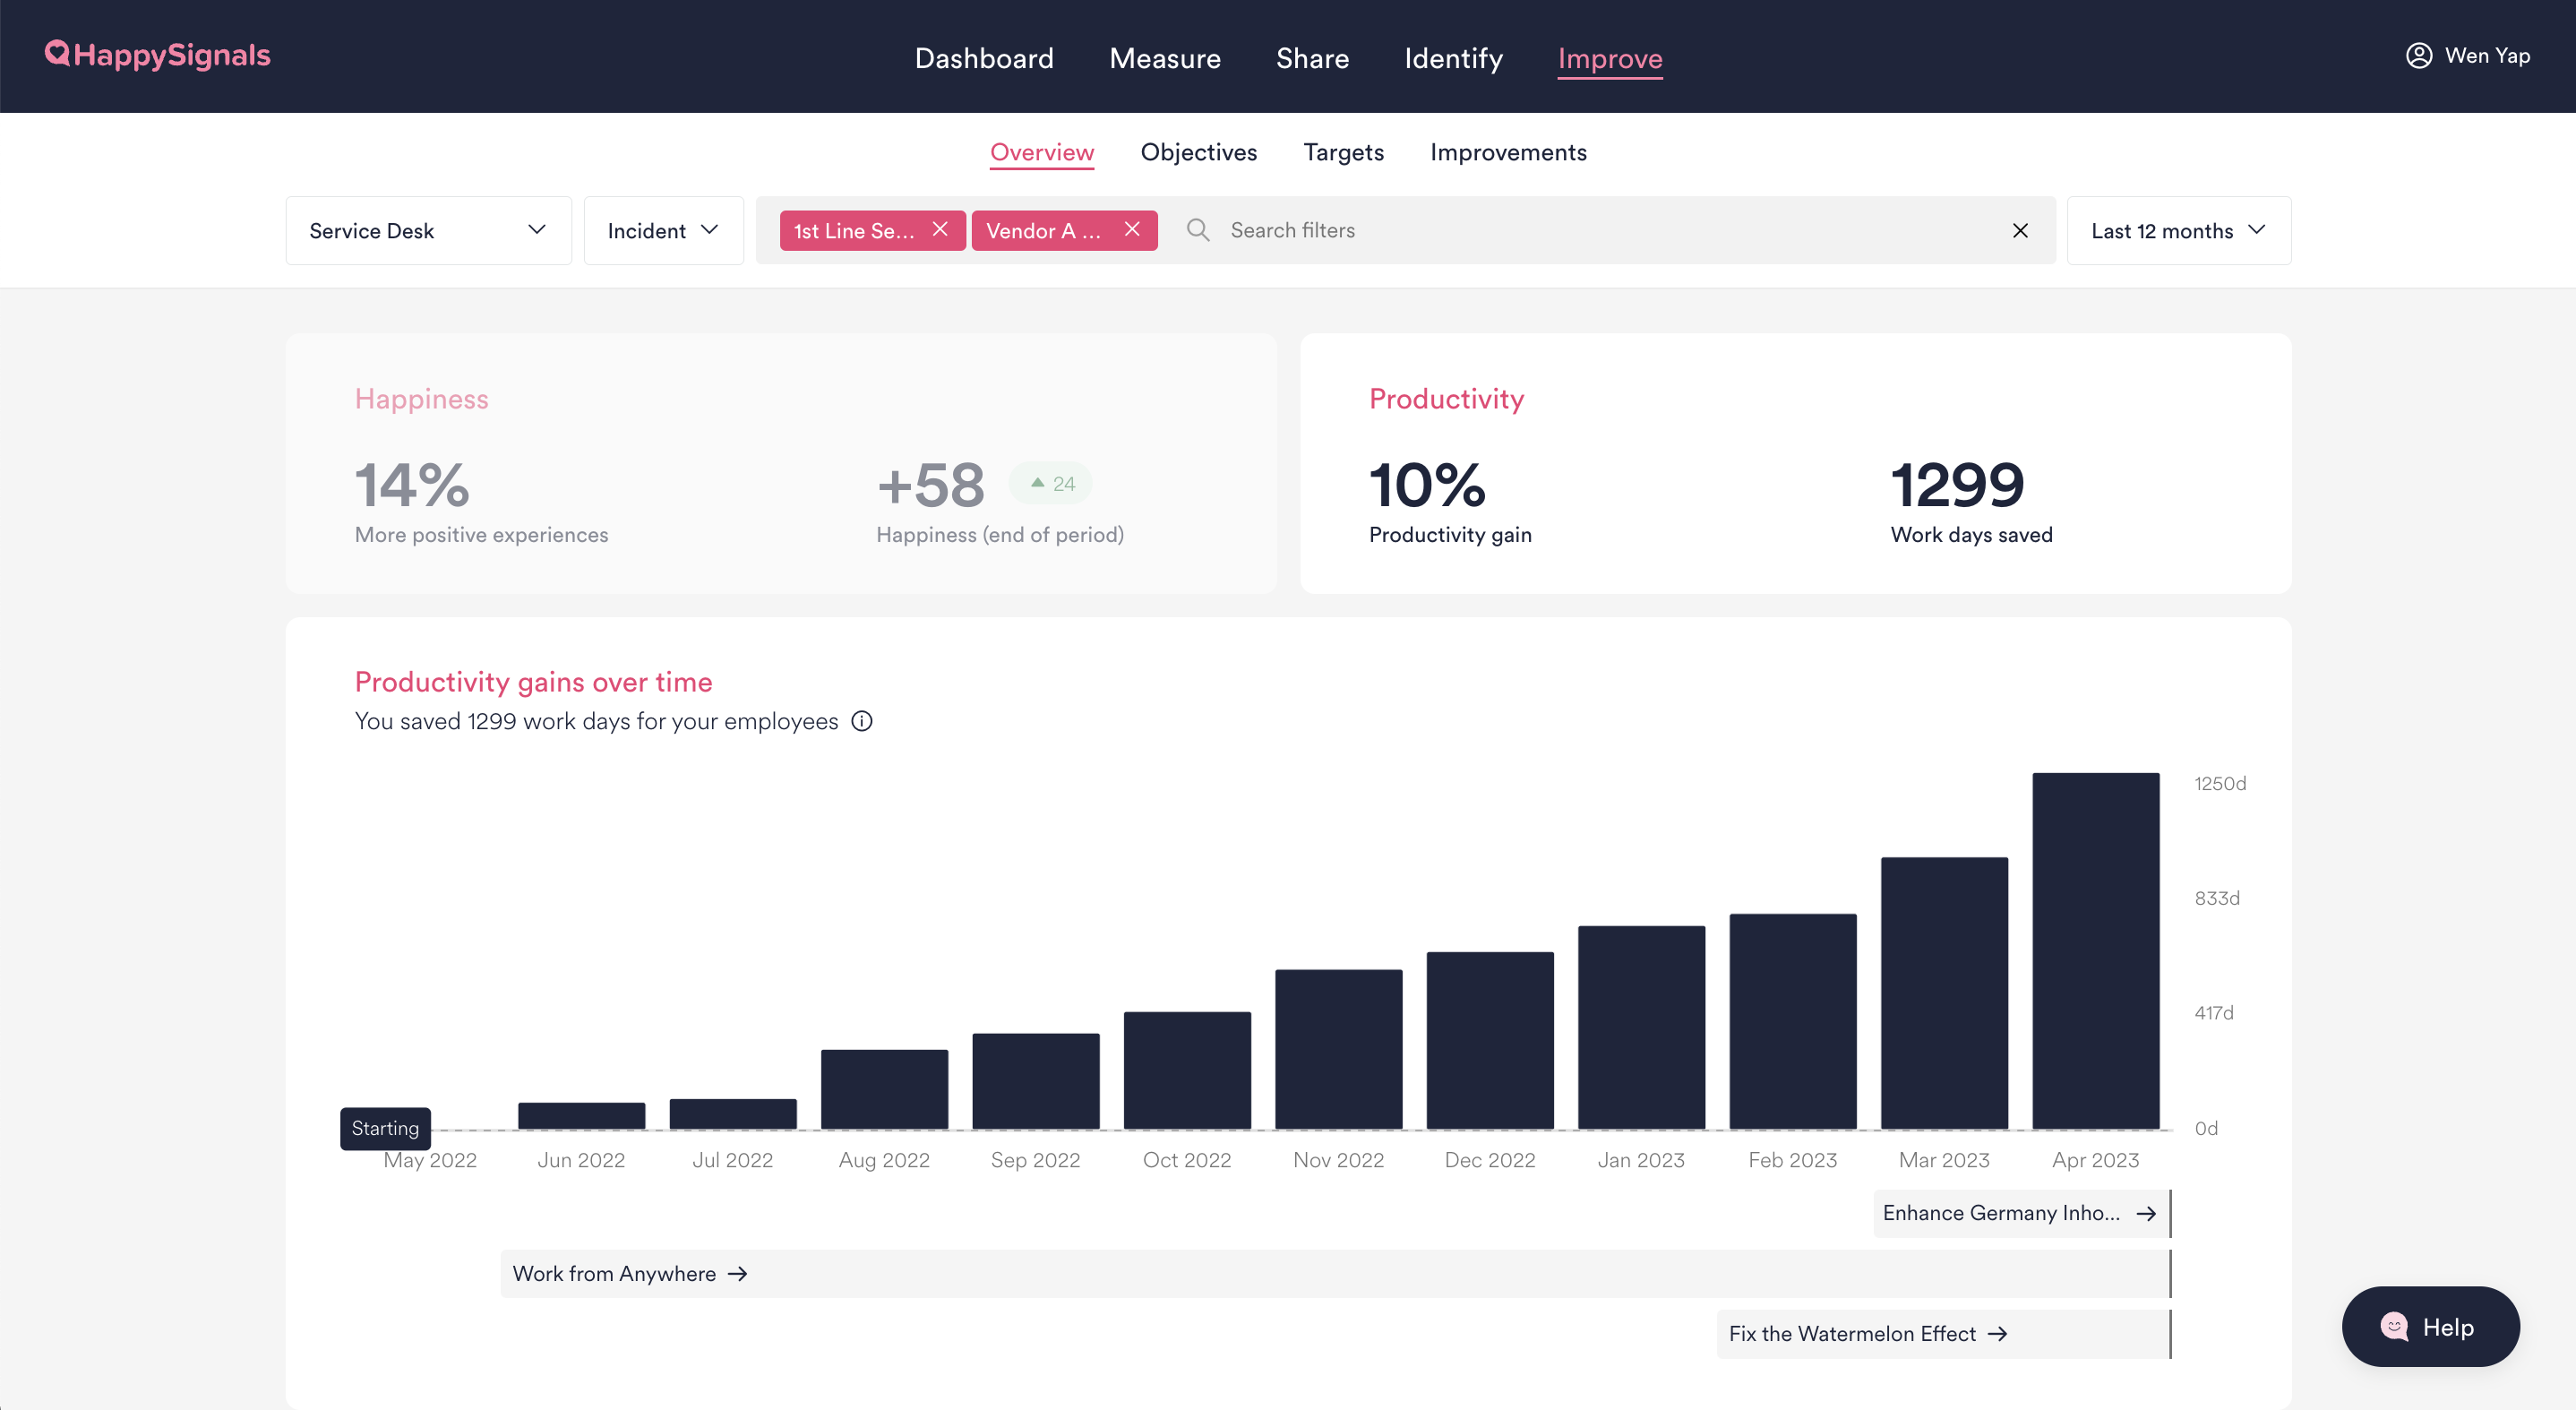
Overview
- View long-term improvements achieved in your focus area: Select different measurement areas, shortcuts, or filters to see how experiences and productivity in those areas have improved over longer periods, like the Last 12 months or All Time.
- Quantify productivity gains: See the productivity gains and work days saved by IT in the time period you're looking at. Productivity gain calculations are based on the cumulative change in Lost Time compared to the first month of that period. Learn more about how productivity gains are calculated
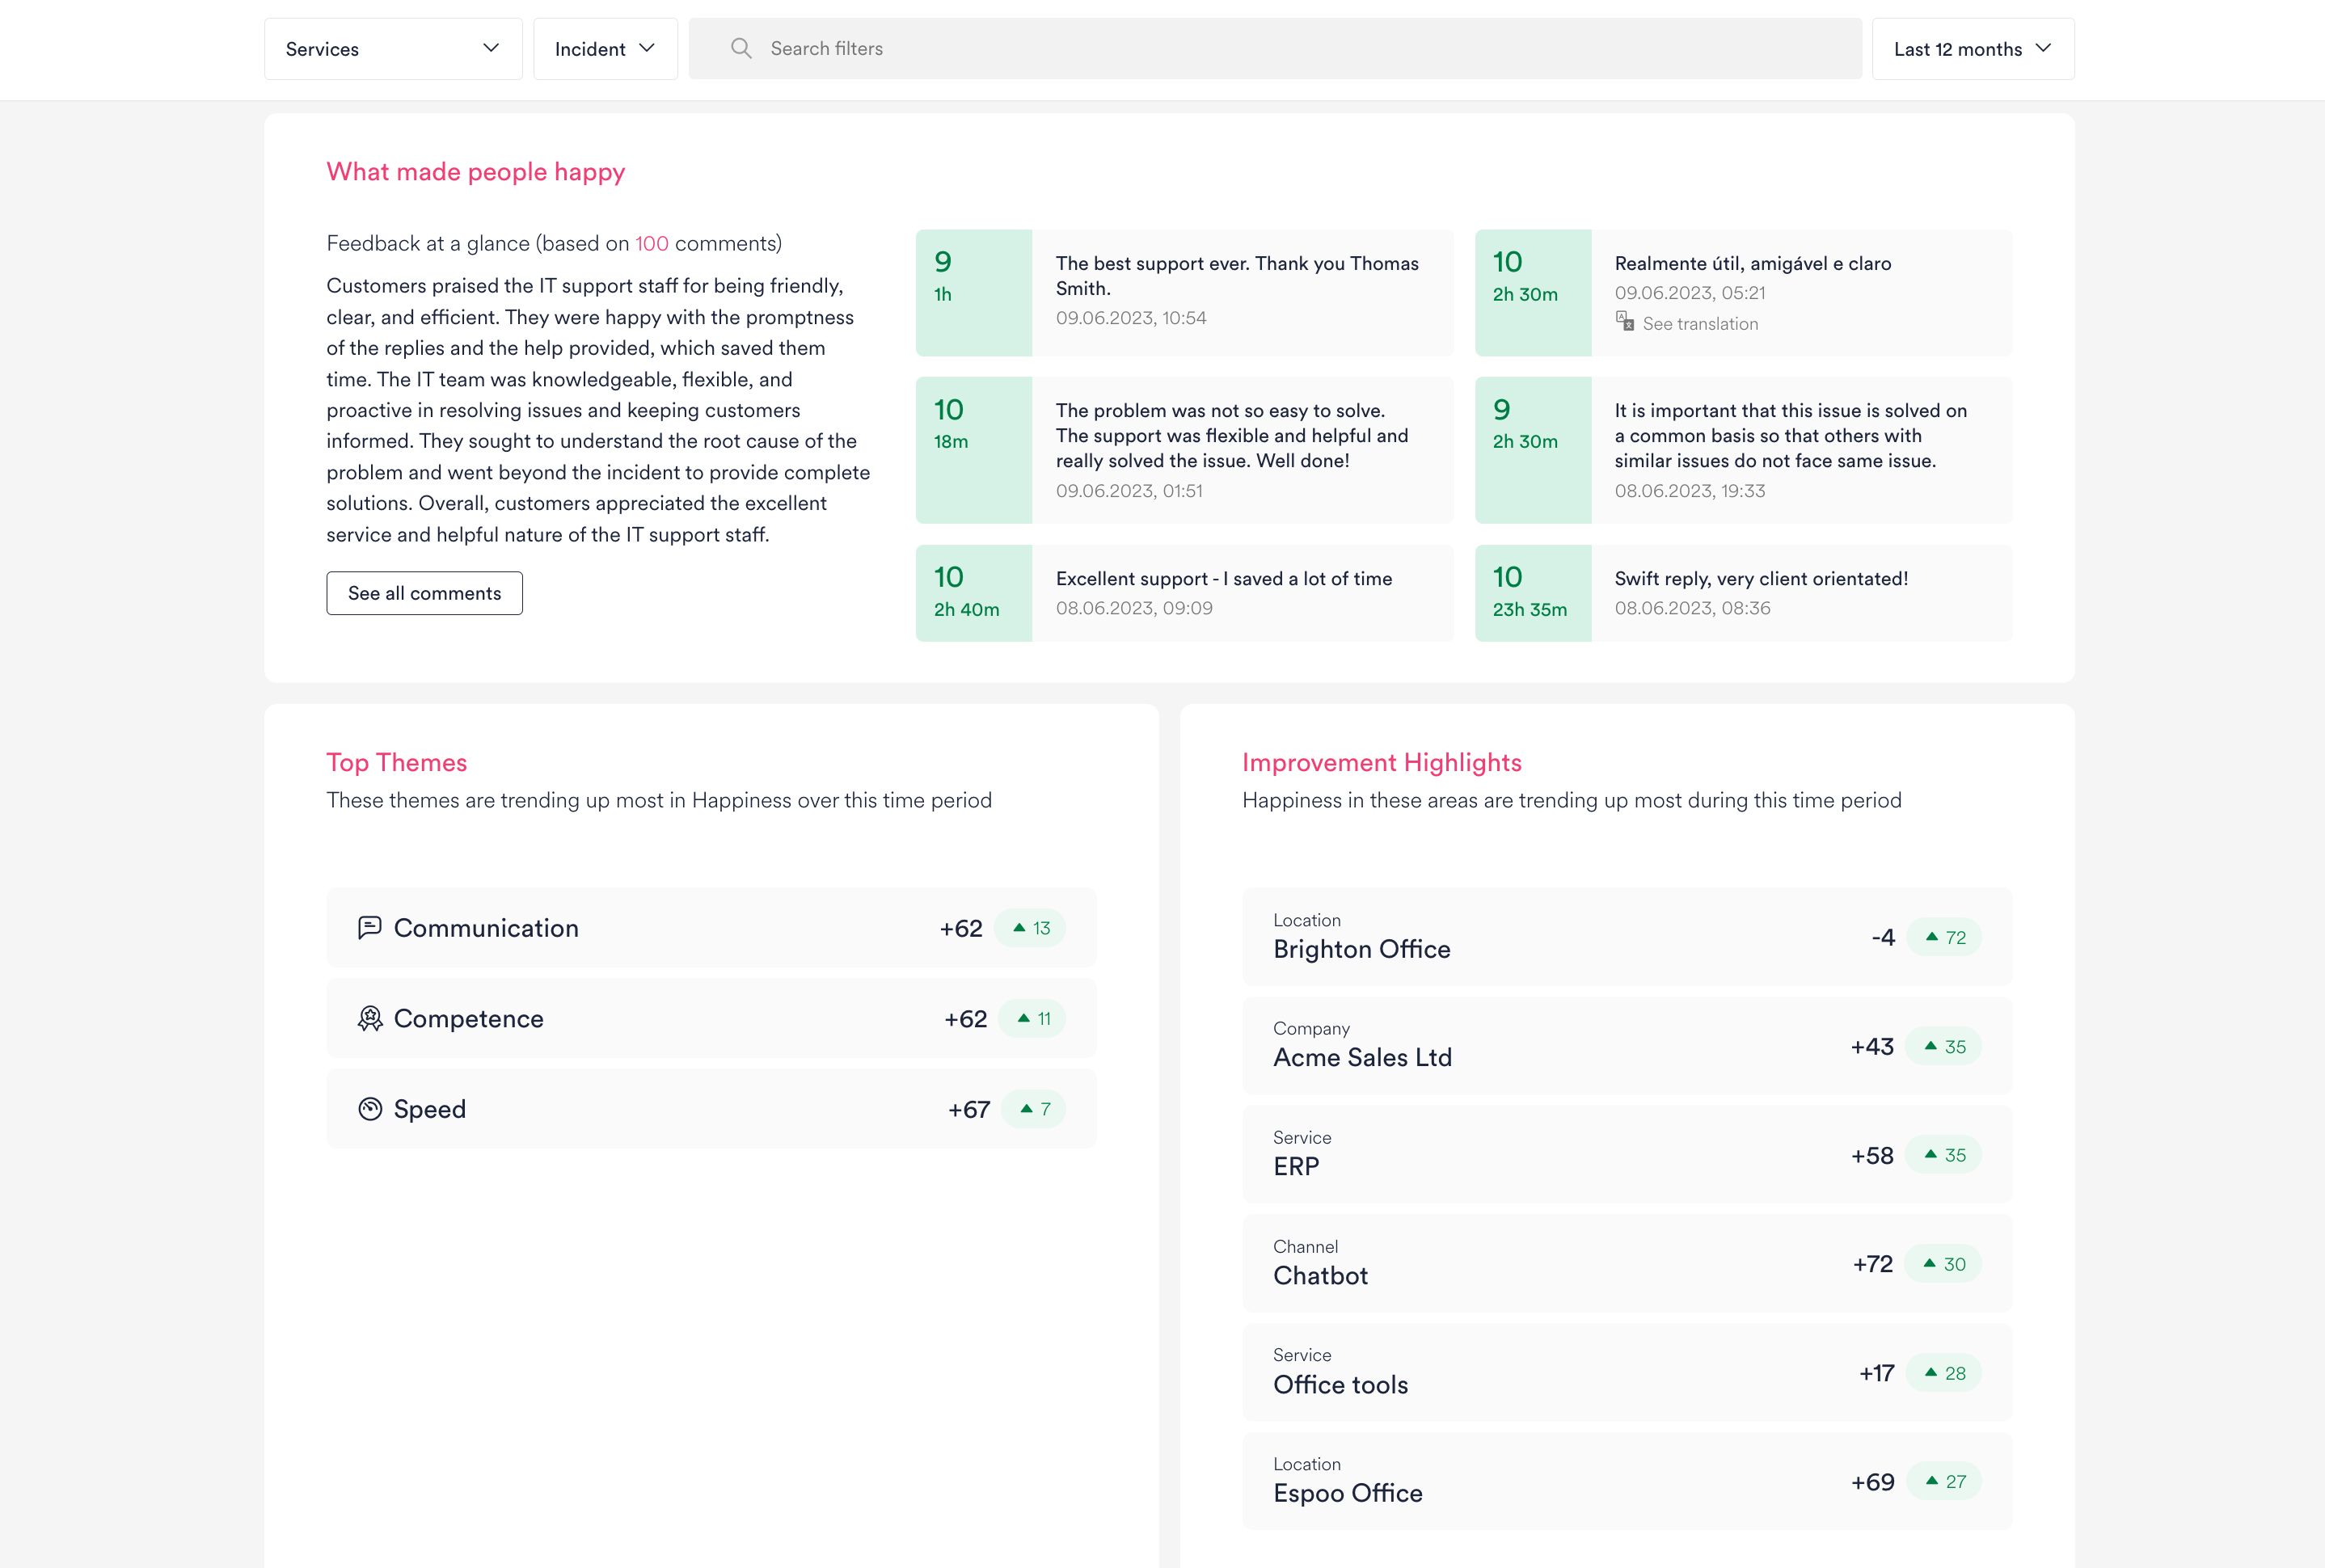
- See at a glance what made people happy: Quickly understand the positive comments people are giving about IT by reading an AI-powered summary, and see the top themes and areas where Happiness is trending up.
- View the Top Themes and areas where Happiness is trending up most
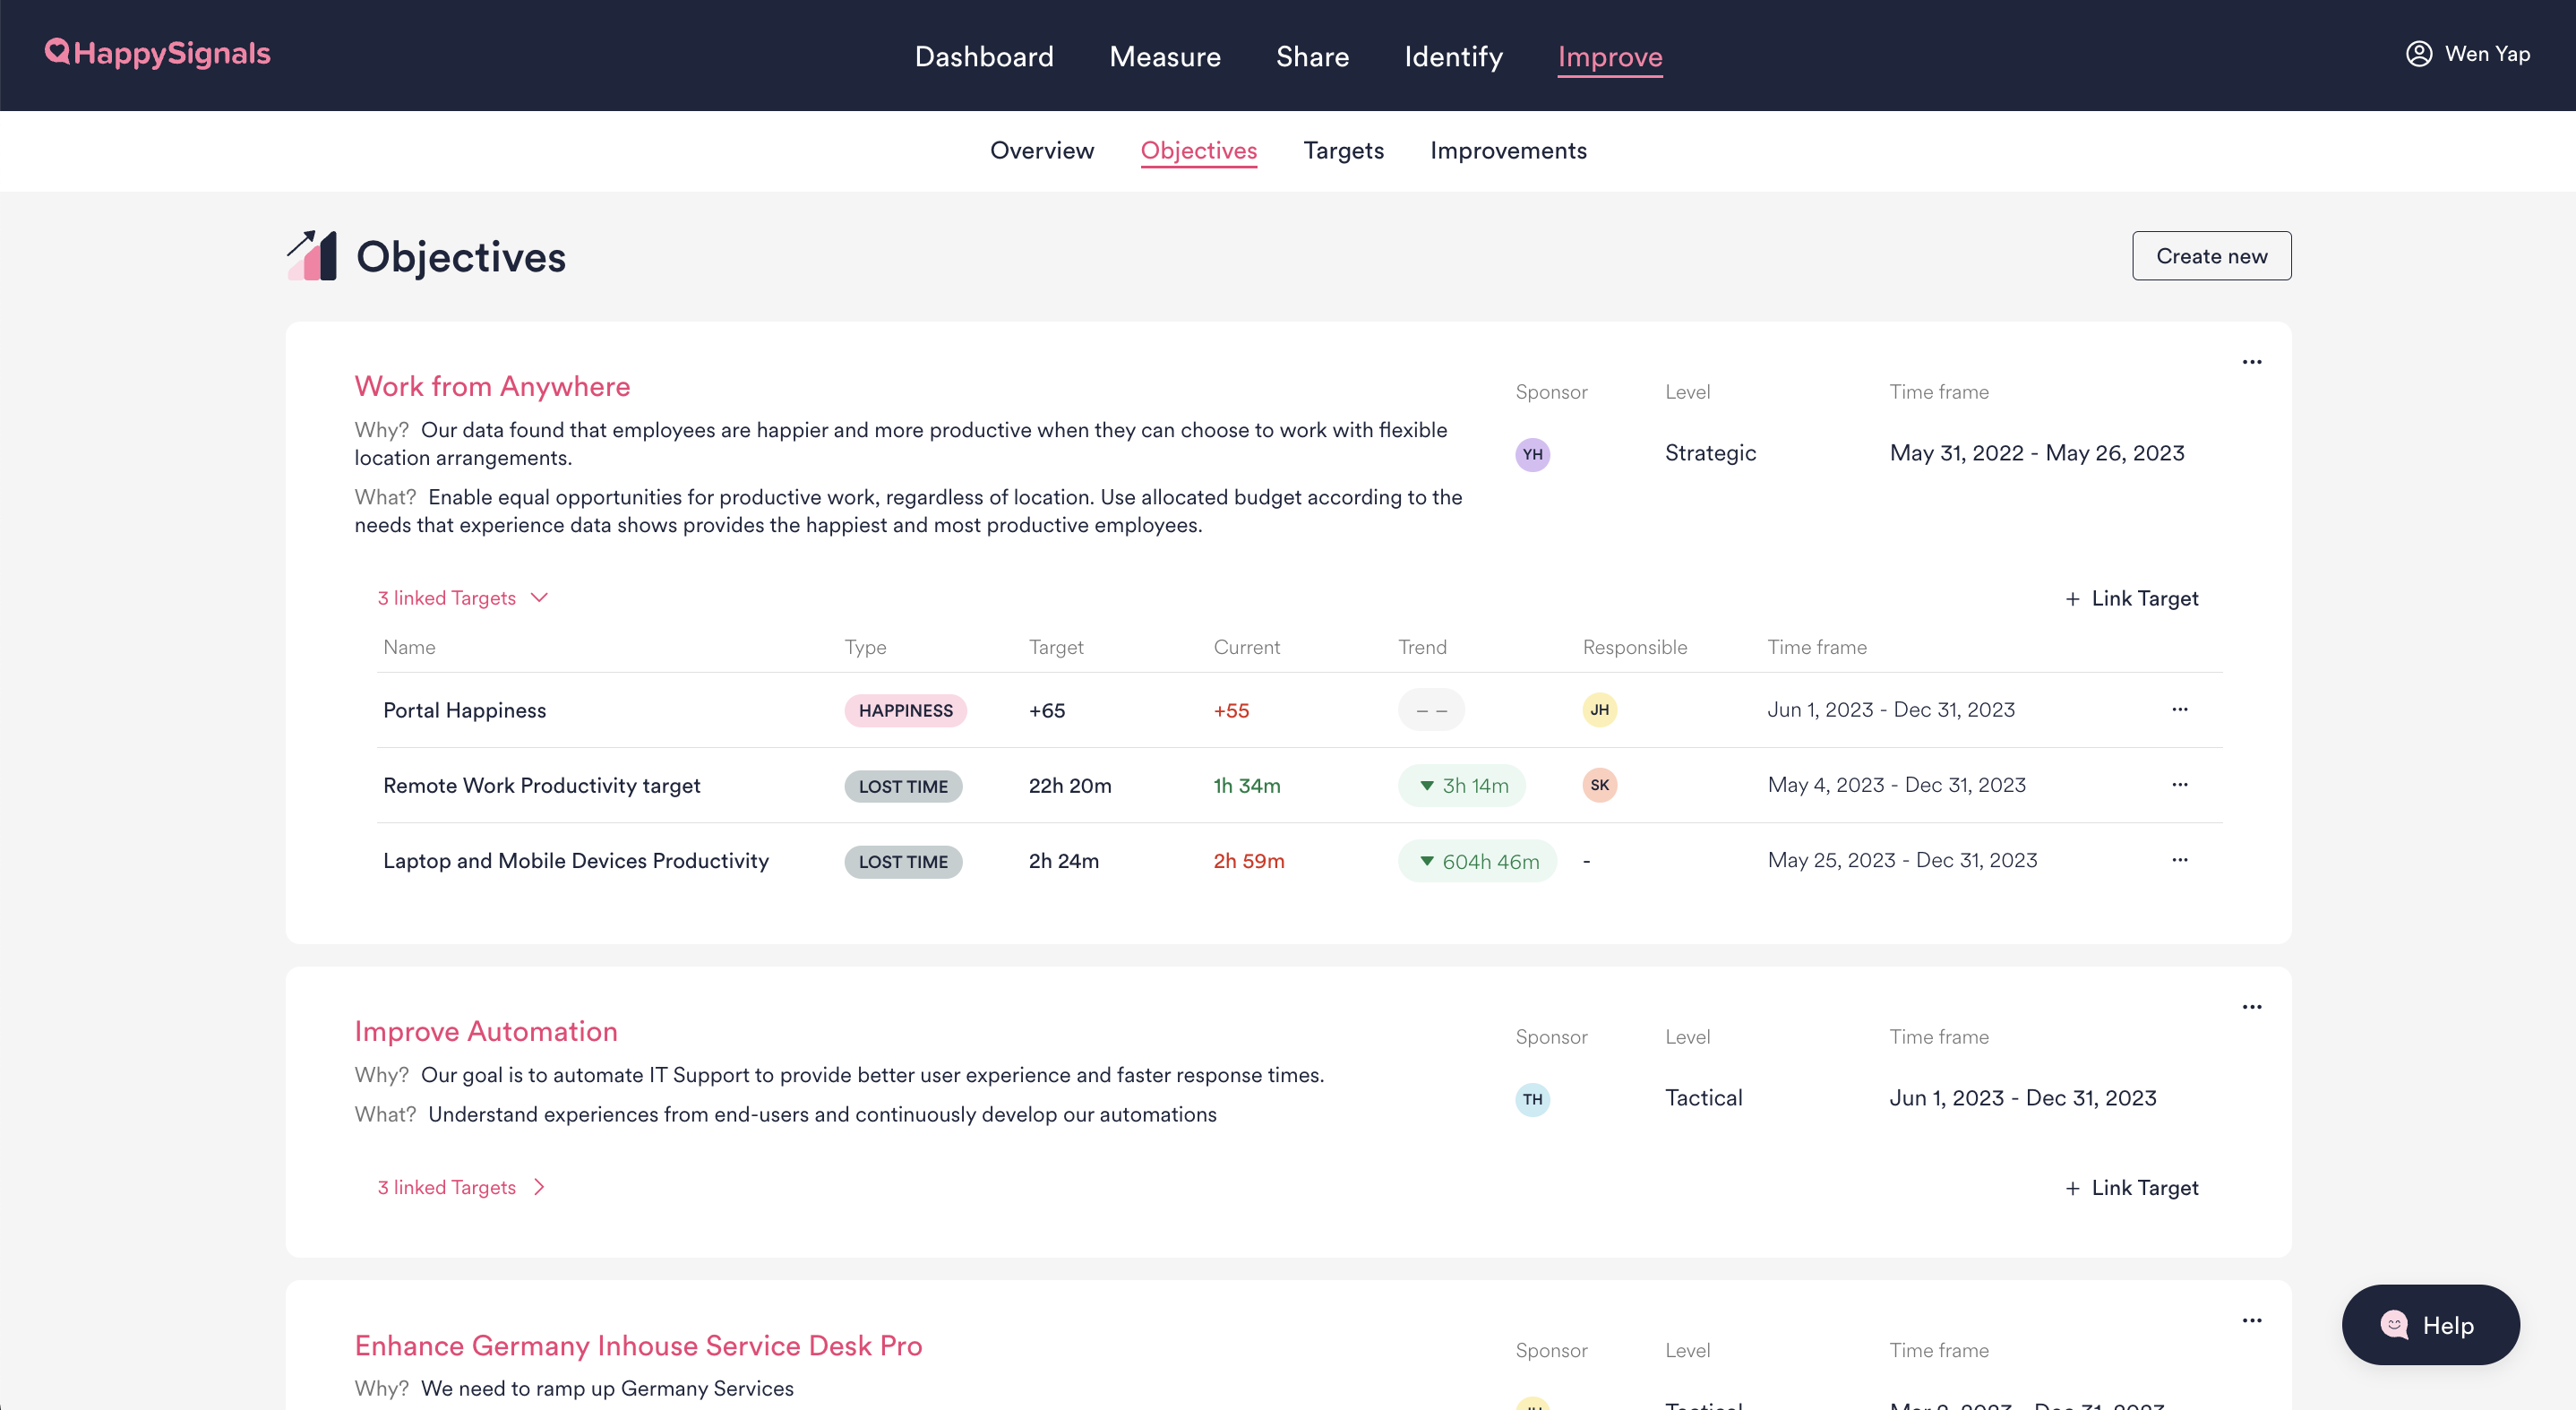
Objectives
On this page, you can create and edit your objectives. Note that only admin users can create or edit objectives. All platform users can view them on the Objectives page, as well as the Improve Overview page.
- Set clear objectives and make them visible on the platform to keep IT teams aligned around a common focus, driving coherent action without micro-management. Learn more about how to set objectives
- Link targets to objectives: Link quantifiable metrics for success to strategic objectives to drive alignment in your teams' improvement actions.
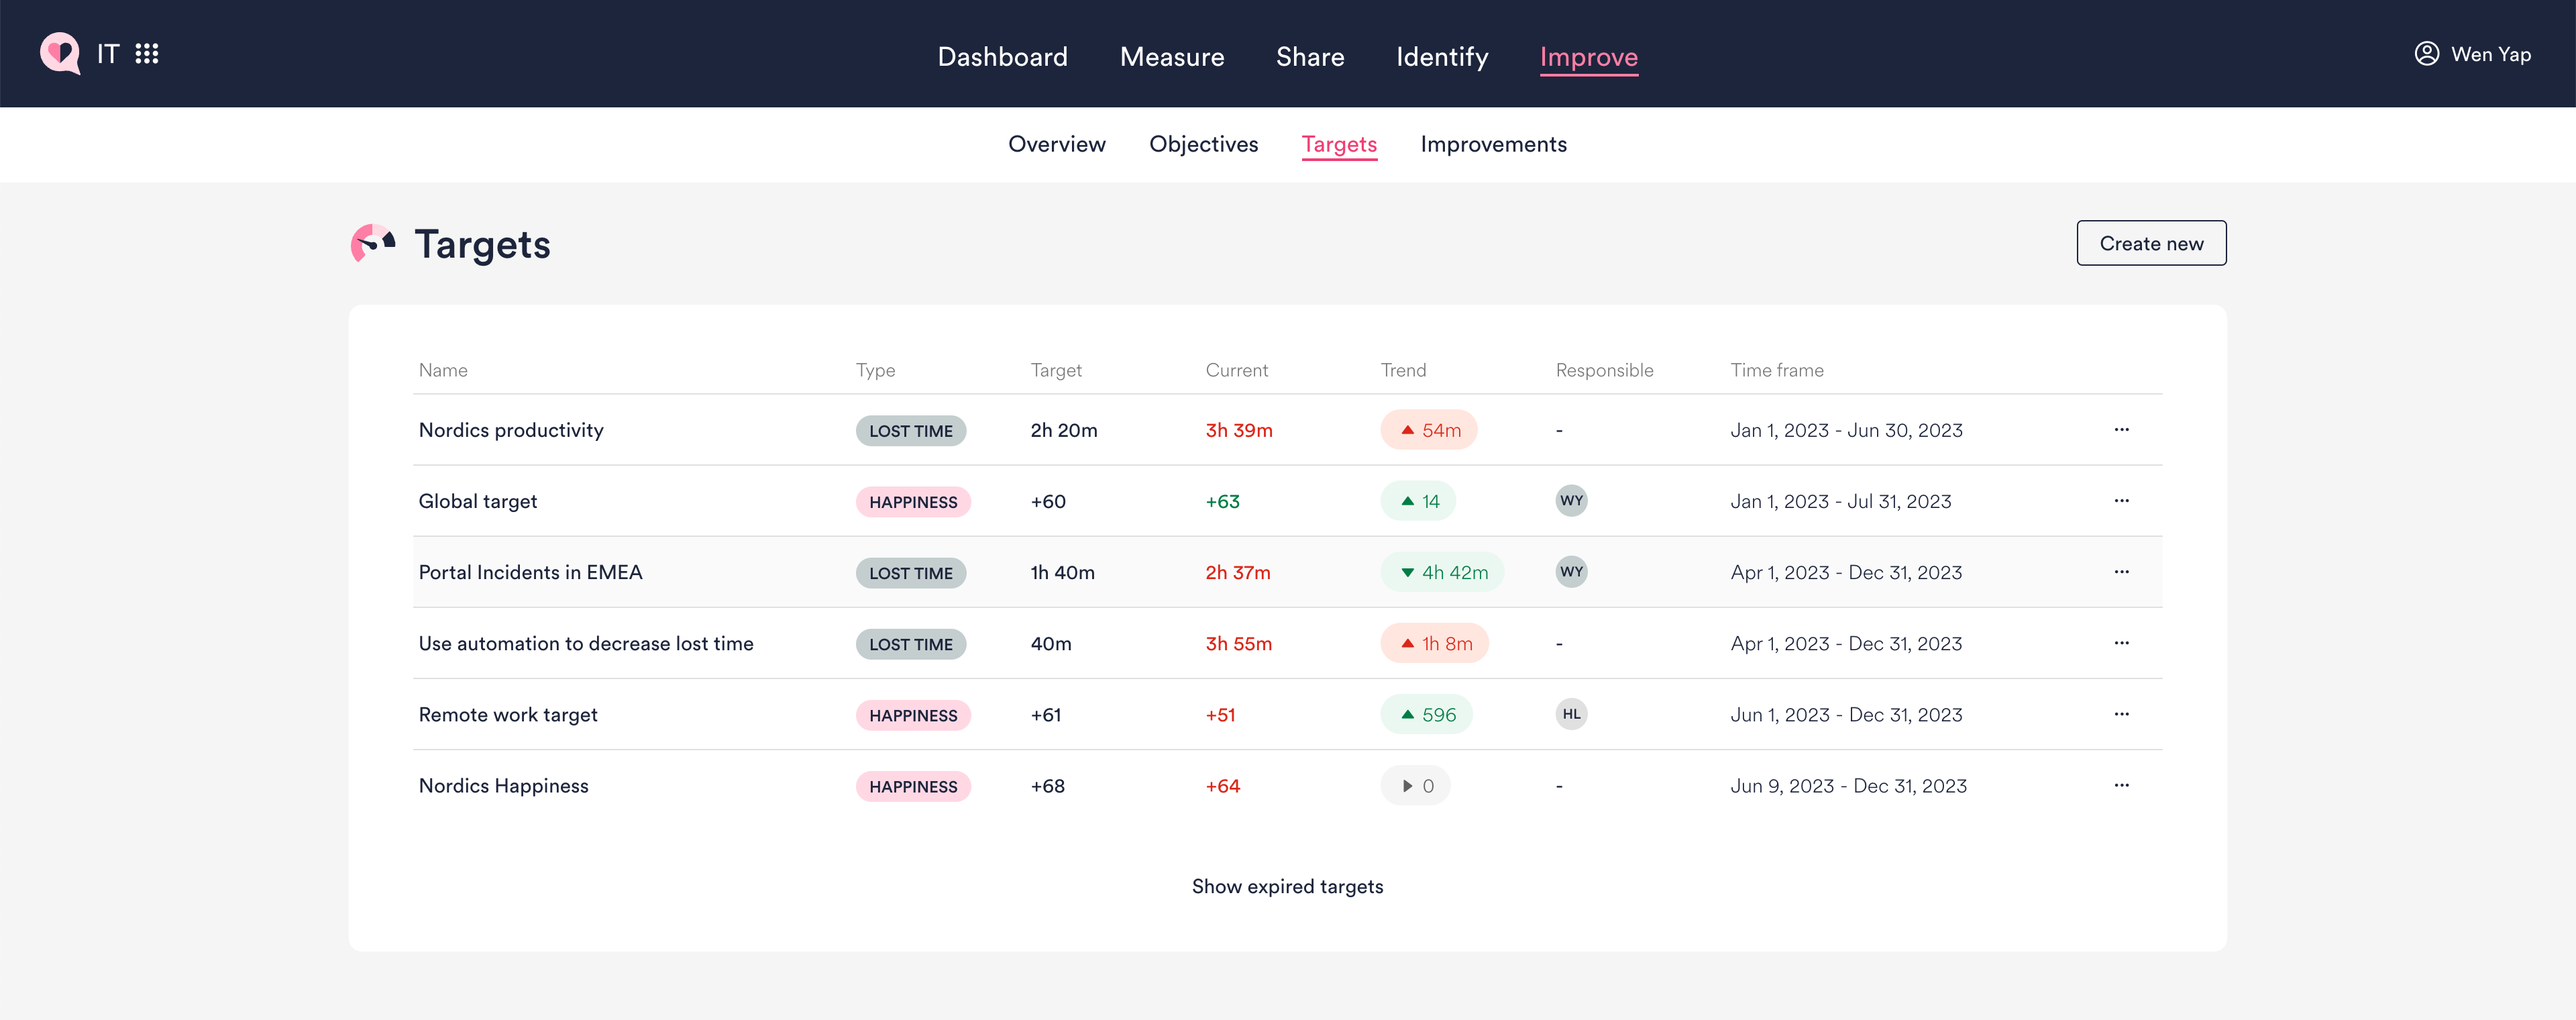
Targets
You can see all the targets you have set on the Targets page. Note that only admin users can set or edit targets, but all users can see the data compared to targets that have been set.
- Set targets from either the Targets or Experience page: On the Experience page, select the filters you're interested in and click 'Set Target' under the Actions menu next to the search bar. On the Targets page, click 'Create new' then select the filters that define the area you wish to set a target for.
- See how you're doing compared to your target: Click on any target on the Targets page and you'll be directed to the Experience page, where the filters from that target will be pre-selected and all the data colored green or red compared to the target.
Improvements
- Identify your improvement area: Select the Measurement Area and filters on the Experience page, or start from one of your Shortcuts.
- From the Actions menu on the Experience page, click ‘Improve’ to create an Initiative or XLA. You can also click ‘Create Improvement’ from a Shortcut in the Measurement Area dropdown.
- Give your Initiative or XLA a name, time frame, and target, then create!
Learn more about Initiatives and XLAs and how their metrics are tracked
- See what has changed since the start
- Check if you are on track to meeting the target
- Add Notes to document key decisions and actions