Terms
- Baseline
- Benchmark
- Employment Time
- Experience Drivers
- Experience Indicators
- Focus Topics
- Happiness
- Impact
- IT Support Profiles
- Lost Time
- Productivity gains
- Time to resolve
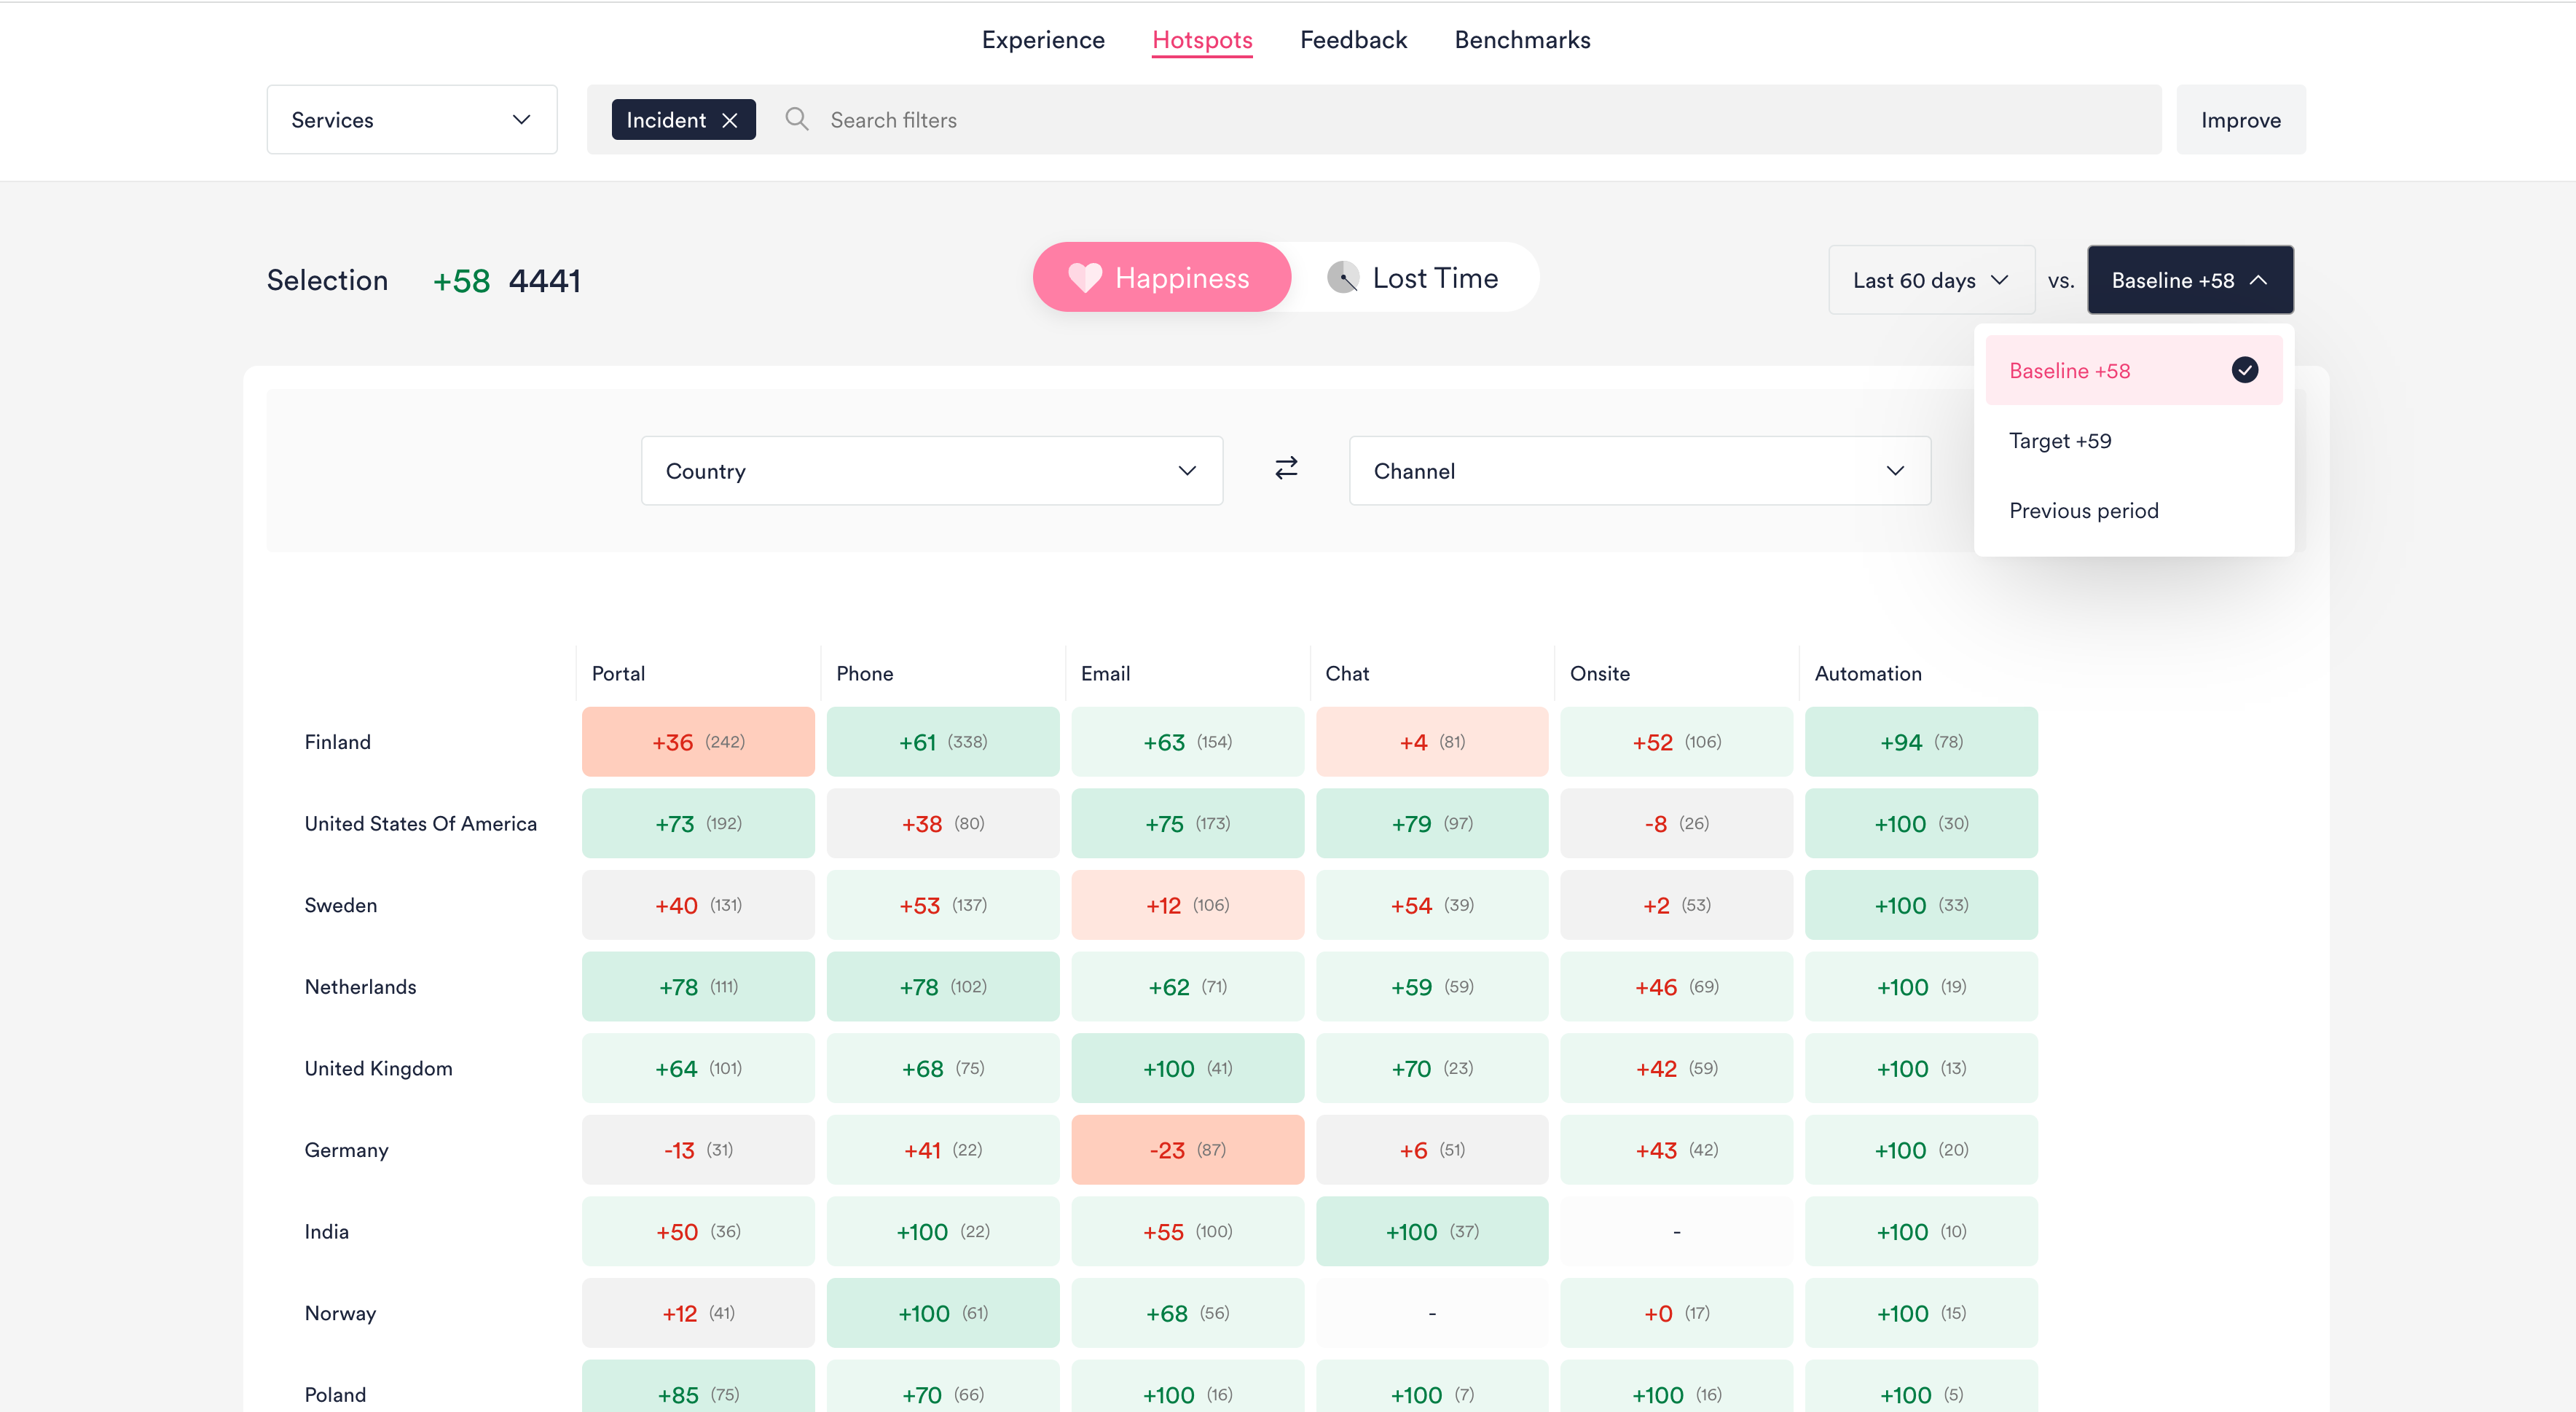
Baseline
On the Identify > Experience page, you can compare Happiness / Lost Time in specific IT areas to your Organization Baseline.
Your Baseline is calculated by using NPS formula on all responses in the organization for the Measurement Area and/or the ticket type (if any) you're looking at, during the selected time period – e.g. All Incidents, All Remote Work.
Benchmark
Employment Time
Time from the employee’s Employment Start Date to when their survey response is received. Employment Start Date field defaults to when the user record was created in ServiceNow.
*For now, this data is only available for ServiceNow customers who have activated collection of employment time data.
Experience Drivers
Experience Driver refers to a group of Experience Indicators related to same topic. Each Experience Indicator belongs to one Experience Driver. With the help of Experience Drivers it is easier to see what kind of topics have the biggest impact on experience. This is done by analysing which Drivers have the highest share of responses. Experience Drivers can be found on the Dashboard.
Experience Indicators (previously called "Factors")
Focus Topics
Focus topics refer to the most common open text feedback topics recognised from HappySignals global benchmark. Customer specific open text feedback is categorised into these global topics with the help of AI. Focus Topics with most responses are shown on the HappySignals Dashboard and help to focus on the areas that according to employees require most attention.
Happiness
On HappySignals surveys, end-users rate how happy they are with the IT area being measured (e.g. IT Incident or Request, Enterprise Applications, etc) on a scale from 0-10.
Impact
On the Identify > Hotspots page, we color heat map cells red, light red, gray, light green, or green based on Impact. Impact is a factor of experience and number of affected end-users, i.e.
Impact = Response volume x (Happiness/Lost Time - Target/Baseline/Previous period)
IT Support Profiles
HappySignals' behavioral profiles to categorize different end-users and their needs when interacting with IT support services.
Note: Our IT Support Profiles are only relevant in the context of IT Incidents.
Based on research interviews with over 500 people, we distilled four profiles which differ in terms of their Competence (how capable the end-user is of resolving IT issues themselves or talking about IT-related matters), and Attitude (how willing the end-user is to solve IT problems on their own):
- Prioritizers are familiar with IT but do not want to use their own time with IT issues. They expect the service desk to resolve issues.
- Doers are capable of solving issues themselves using self-help tools. They also often help colleagues with IT issues.
- Supported are not comfortable with technology, not willing to read instructions, or learn to use self-service tools.
- Triers try to fix IT issues themselves but usually don't manage to. They prefer personal help and want to learn from it.
Learn more in our Guide to using Profiles in IT Service Desk
Lost Time
On HappySignals surveys, end-users are asked to estimate how much work time they lost due to the IT area being measured. The average lost time across end-users' responses is displayed on HappySignals Platform, e.g. 2h 50m.
Learn more about how Lost Time is calculated.
Productivity gains
In the Improve section, you can view the productivity gains achieved by IT for different measurement areas or more granular filter sets.
We calculate Work days saved as the cumulative change in Lost Time for each month compared to the first month of the time period you're looking at. We then calculate Productivity gain as the "Work days saved" compared to the potential total lost time for the whole time period (if no improvements were made from the first month).
For Ticket-based IT areas like Incidents or Requests, our calculations factor in your ticket volumes each month. We calculate ticket volume based on the number of surveys sent, since HappySignals ticket-based surveys are delivered together with the resolution of each ticket.

F0r Proactive IT areas like Enterprise Applications or Remote Work, our calculations factor in the number of employees in your organization based on your HappySignals agreement.
