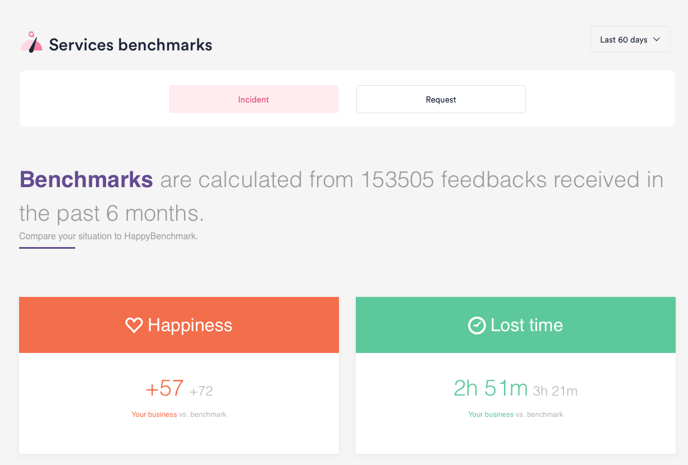
The benchmark page provides you with a benchmark overview of how your data is performing compared to our entire customer base on a global level. It is aimed to provide you with an understanding of where you stand compared to other organizations.
- All global benchmark data is based on a rolling average of the last 6 months of anonymized data from all HappySignals customers
- Your scores which are compared to the benchmark, are based on the selected time period.
- Red indicating not being as good as the global benchmark
- Green indicating being better than the global benchmark
The first section shows the Happiness and Lost time of your ticket-based incidents or requests.
Benchmark data is not available yet for other IT touchpoints.
The page is divided into four sections:
- Happiness and Lost time benchmark
- IT profile benchmark
- Channel benchmark
- Country benchmark
Support Profiles
The IT profile benchmark provides you with an overview of how your IT profile distribution compares to the rest of our clients. Following the same logic as with Happiness and Lost time, the grey-colored bar and number represent the benchmark scores, whereas the green or red-colored bar and number represent your organization's scores.
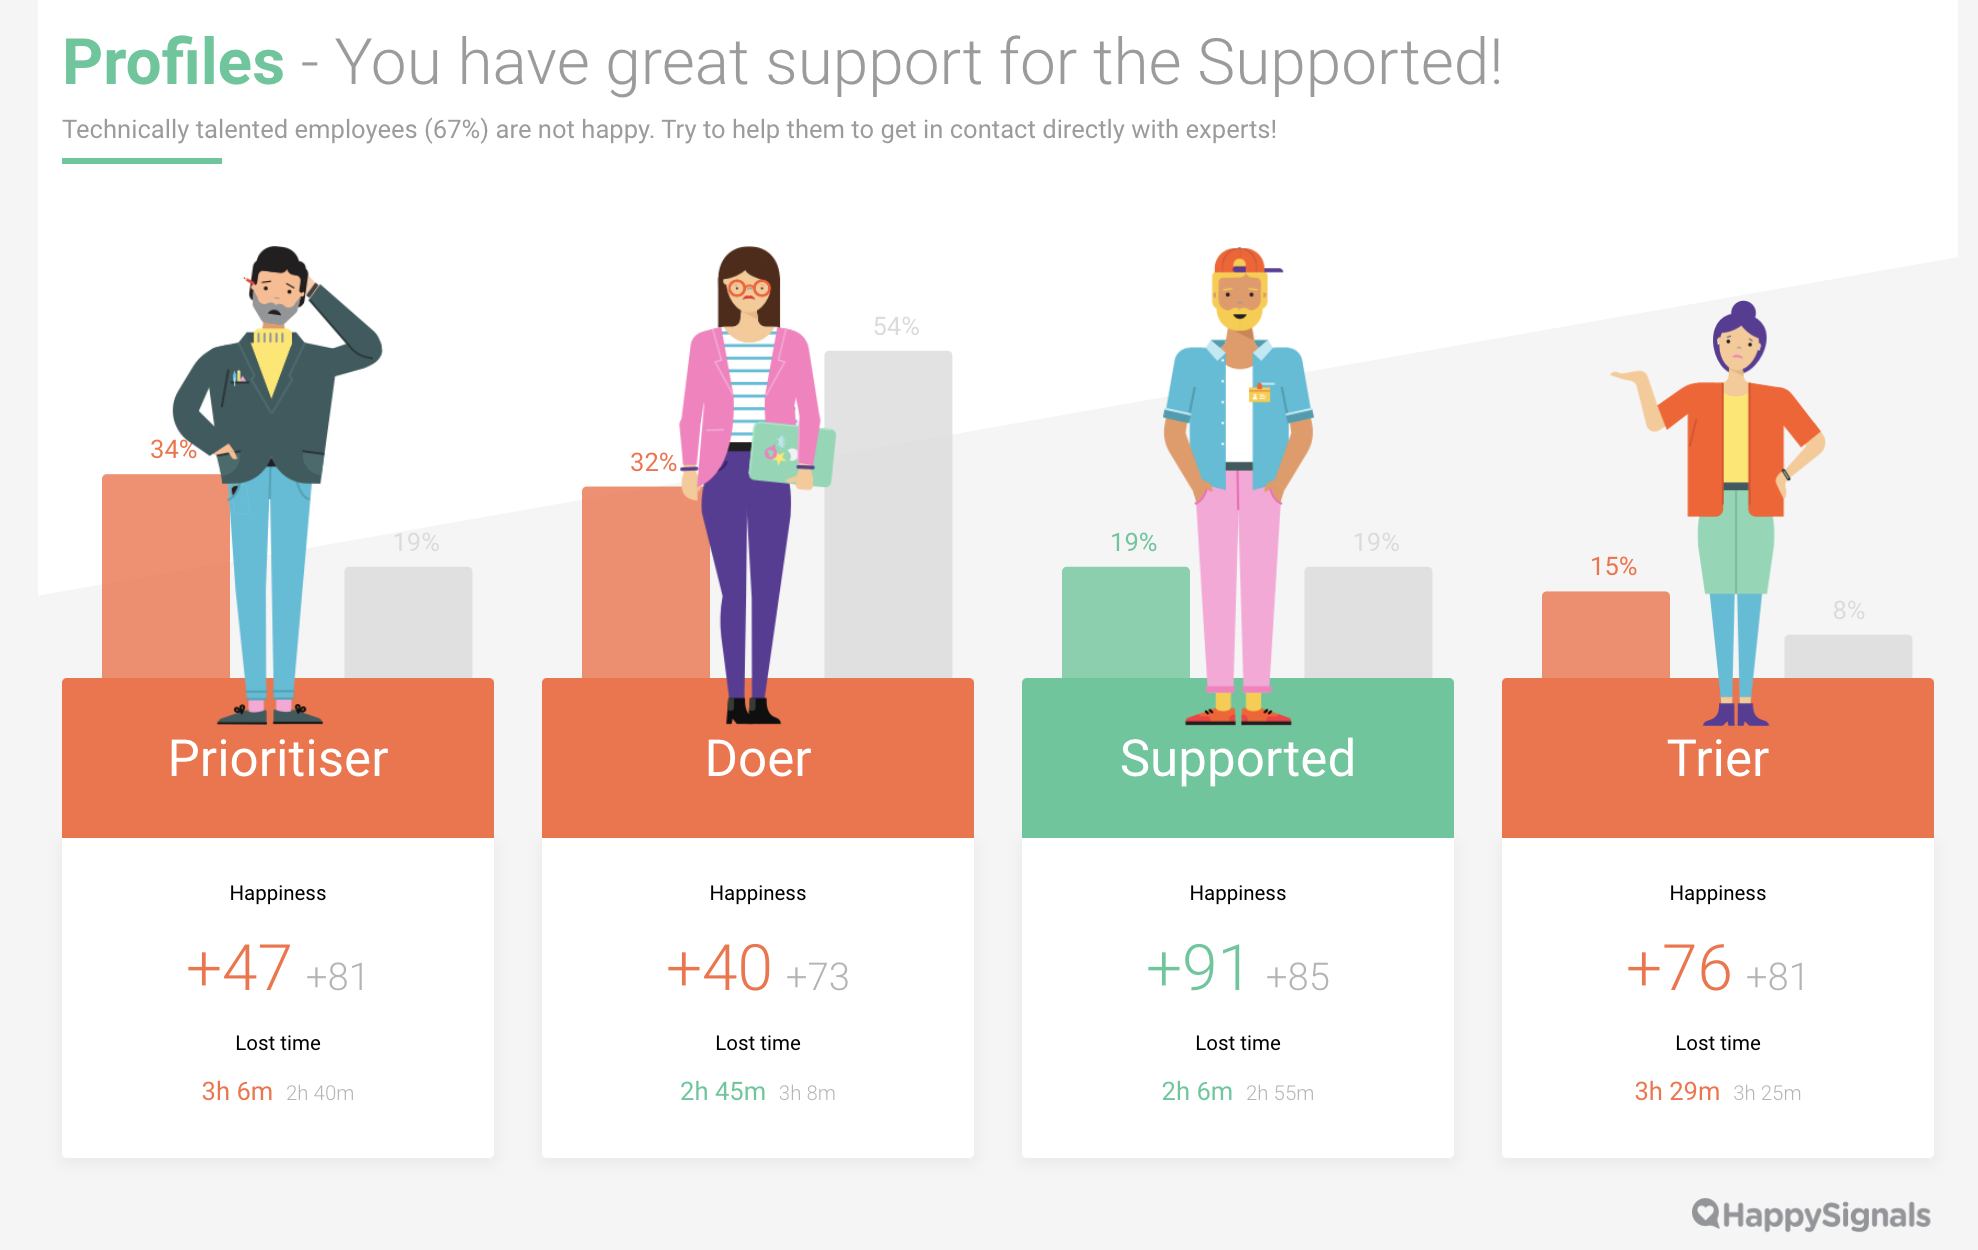
To gain further information on how we define IT profiles and how to work with this them, feel free to read more HERE.
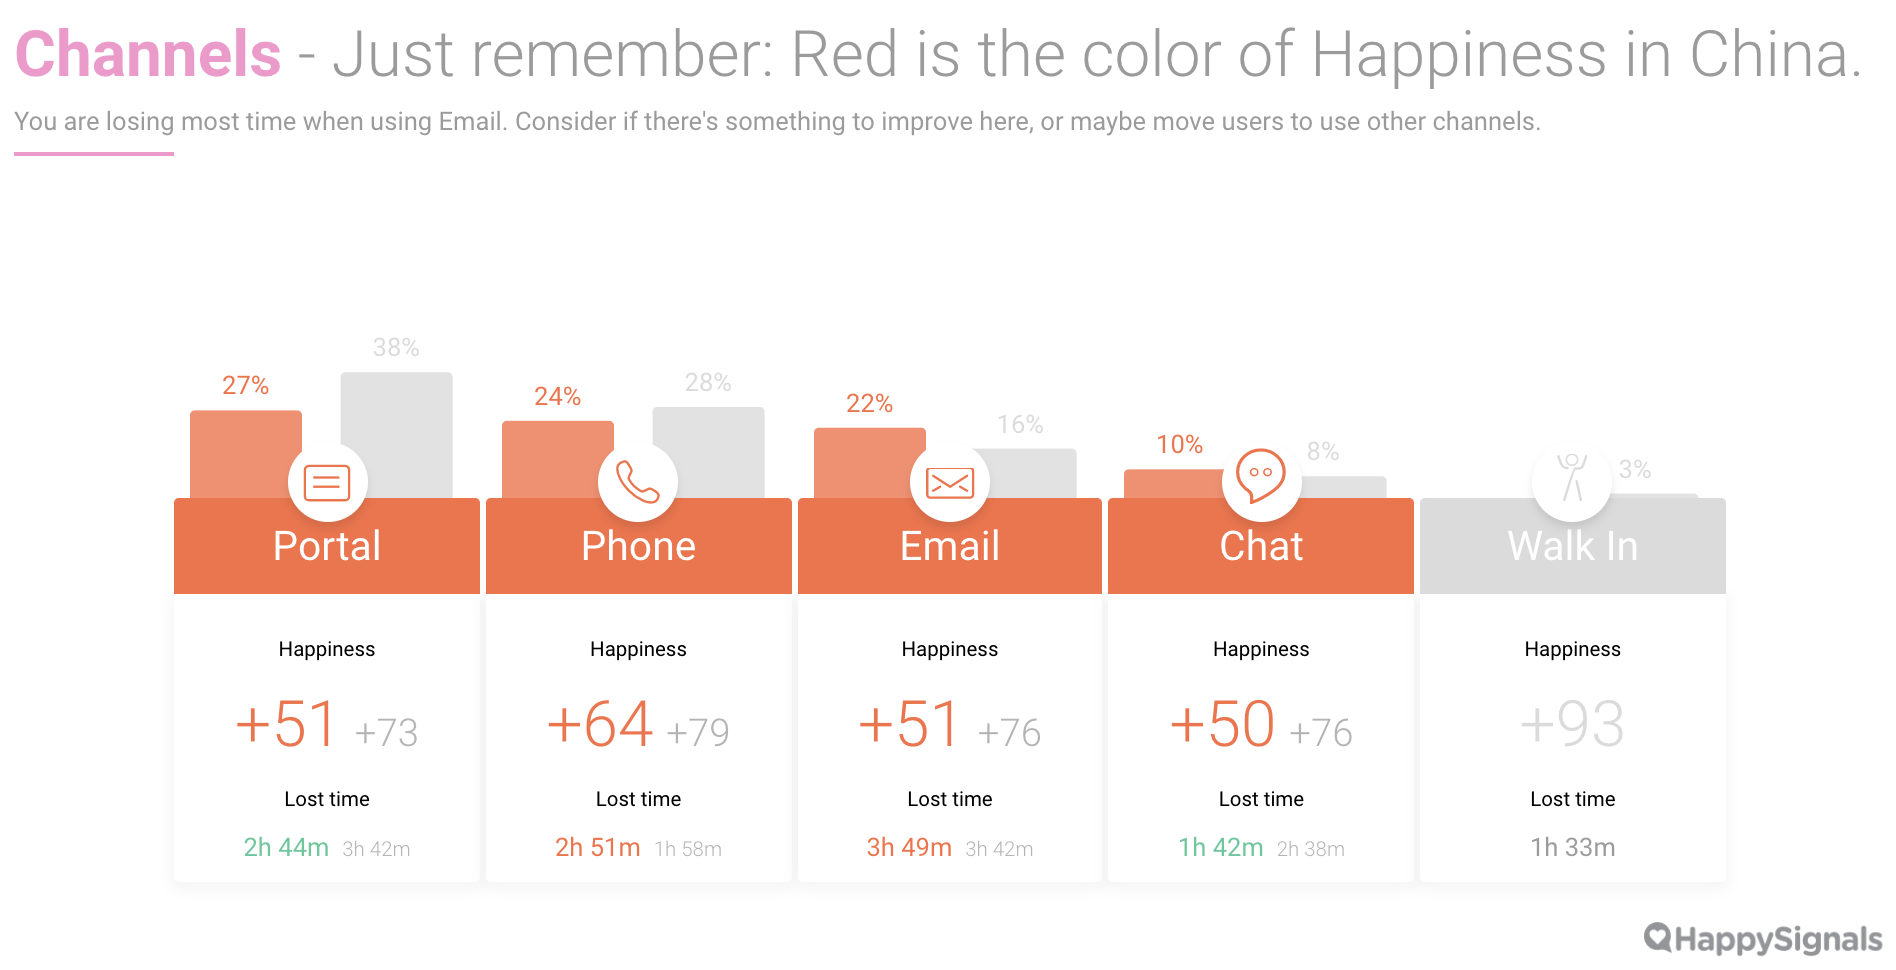
In the channel benchmark section, you will be able to see how your channels compare to channel usage across all our clients, how happy your employees are with each channel as well as how much time you are losing in each channel. The color coding follows the same methodology as above.
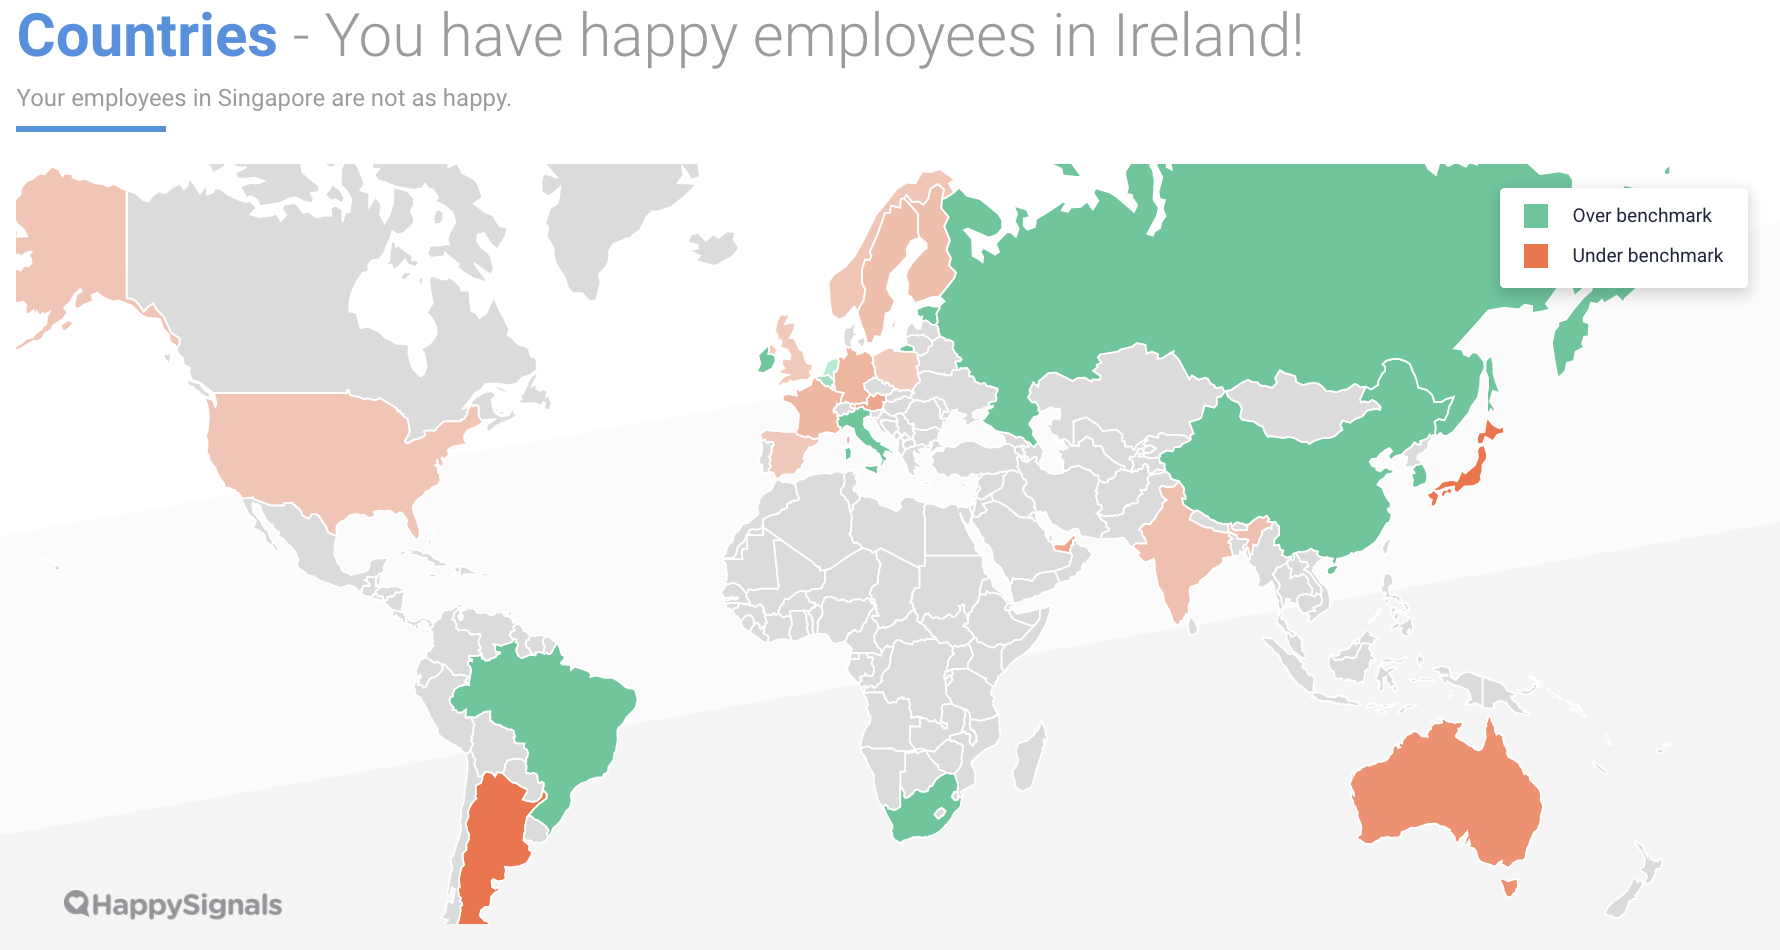
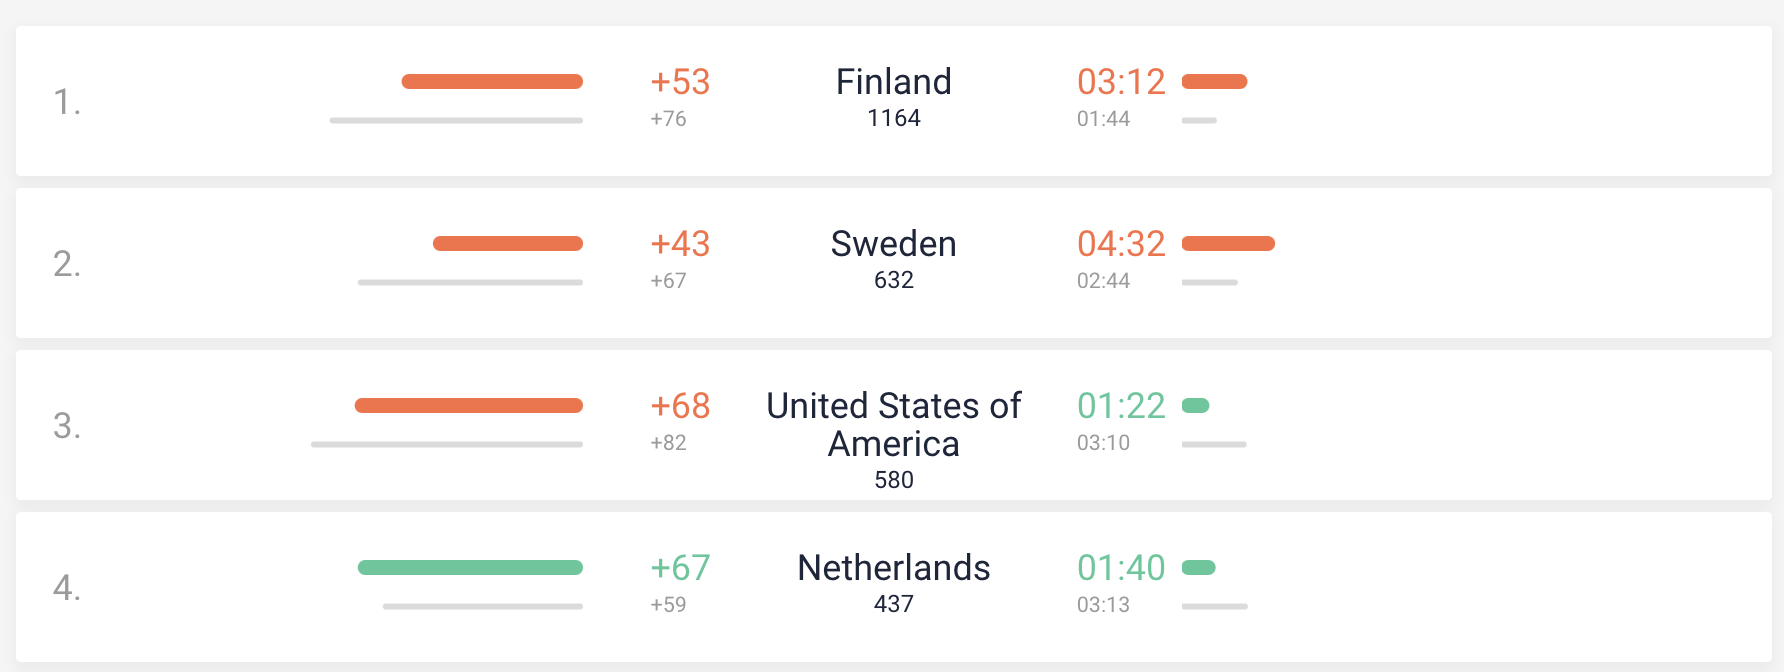
The last section provides you with a global Happiness and Lost time overview across all the countries you operate in. You will see that in some countries and cultures employees tend to give higher scores than in others using Sweden and the USA as an example.
As mentioned, please note that the benchmark page is only available for Service Experience (ticket-based surveys) at the moment. We will be publishing more benchmarks for other measurement areas, such as the IT Experience and Portal Experience once the volume of responses is deemed reliable and comparable. We want to make sure we provide representational and meaningful data.
Take a look on our Global IT Experience Benchmark Report!