Feedback
The Feedback page is the place where you can hear the voices of end-users, and learn the exact reasons why they are happy or unhappy with IT, from their own words.
The Feedback page shows all open text feedback given and reasons why selected by end-users, depending on the measurement area and/or data filters you’ve selected.
Of course, you would want to know how exactly people feel about their experiences. That’s why we made the Negative, Positive and Neutral Feedback toggle the main navigation tool, based on the scores end-users have given.
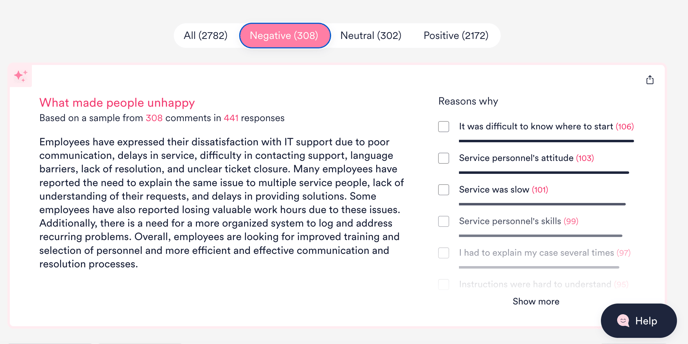
AI Feedback Summary
AI-powered summary instantly gives you a rich overview of what end-users are saying about their experiences, without needing to read their comments one by one! Share the concise overview with your colleagues and stakeholders easily by saving an image.
AI Summary continuously updates to highlight key insights, showing what’s working well and what areas need improvement based on the data you’re reviewing. It’s not a black box — drawing from the feedback data you can easily access. AI simply organizes and summarizes this information in a clear, time-saving way.
Click to filter for feedback related to different reasons why end-users had poor or great experiences, to get more detailed insights from their free text comments.

Filtering feedback
There are many ways for filtering feedback. Filters on the left panel, like Country, will follow you to the Experience page. Same happens with Reasons why people are happy or unhappy. Mentions and tags are specific for the Feedback page.
You can filter feedback using context data filters (e.g. Services, Assignment Groups, Channels), as well as response data filters (e.g. Score, Lost Time). The number of comments received is shown in brackets next to each data value, sorted from most to least comments.
Specific feedback filtering functions
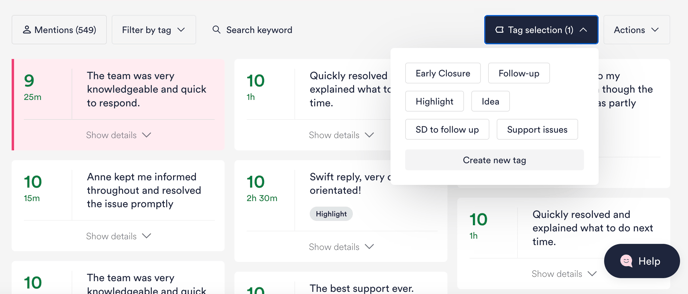
1. Tags
Tagging feedback will allow you to categorize feedbacks into action points where a follow-up is needed or a follow-up has been completed.
Click to select multiple comments related to the same issue and tag them at one go. You can revisit tagged comments anytime from the 'Filter by tag' menu.
Note: Only users with an Administrator role can create new tags or edit existing tag names. Tags and the tagged comments can be seen by all users in your organization, regardless of role.
2. Mentions
Have end-users mentioned specific people in their feedback? Click "Mentions" to see the comments that contain names, such as compliments to staff for providing helpful service!

Customizing your view
There are two different ways you can customize your view of the Feedback page.
Customizing the Filter panel
You can change the order and visibility of categories in the filter panel to more easily access your commonly used data filters.
Click 'Edit categories' and drag to rearrange, or toggle on/off to make categories visible/hidden for each measurement area. For example, you can move categories like Country or Assignment Group up if you use those often, or hide categories that you don’t need.
Note: Your selections will only affect your own filter panel view, not that of other users in your organization.
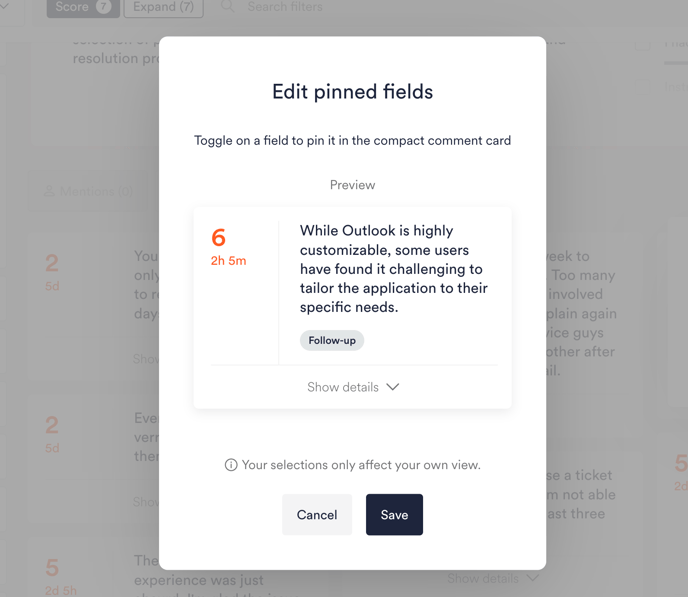
Pinned fields
You can edit what fields of the comment cards are shown by default.

Download data
If you download data for manual analysis, you'll now find it easier to limit what the download contains. Your downloaded Excel file will only contain the responses you see on screen on the Feedback page. This means that only responses that match any selected data filters, tags, as well as keyword search results will be included in the file.
To download all responses in your filter set (including those without free text comments), toggle on 'Show empty' before clicking 'Export as Excel'.
