๐Ÿš€ Introducing AI-powered Feedback Analysis on HappySignals (June 2024)

Harness the power of AI on our revamped Feedback page, packed with new capabilities to help you get relevant insights in seconds from open text feedback.

If youโ€™re in IT and responsible for delivering great experiences to your end-users, you're likely diving into open text feedback to find detailed insights and areas for improvement. But let's face it, it can be tedious and time-consuming to get insights from hundreds (or thousands!) of free text comments. Our data suggests large enterprises can spend up to 20 hours a week reading, organizing, and analyzing their feedback! 
Thatโ€™s why HappySignals is excited to announce the launch of AI-powered Feedback Analysis on our IT Experience Management Platform.

For a demo and deep dive into using the new features, watch this Product Training Session (20 min)

 
Weโ€™ve revamped the Feedback page, making it easier to get relevant insights from lots of free text data with the help of AI
No more spending hours manually reading, organizing, and analyzing feedback. Now both IT and business users can quickly get valuable insights in human language from the sea of end-user feedback. Let AI do the heavy lifting, so you can focus on what you're good at โ€“ making data-driven decisions to improve IT experiences.

Alongside a fresh new look, here are some of the powerful capabilities we've added to the Feedback page:
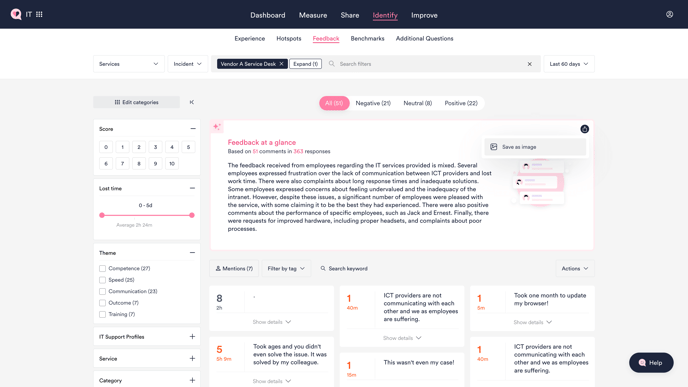
โœจ Get AI-powered summaries of what people said about their experiences and the areas for improvement 

No more drowning in a sea of comments. Our new AI-powered summary instantly gives you a rich overview of what end-users are saying about their experiences, without needing to read their comments one by one! Share the concise overview with your colleagues and stakeholders easily by saving an image.

Learn more about how HappySignals uses AI

๐Ÿ’ฌ Focus on reasons why people had poor or great experiences

With the new toggle navigation at the top of the page, you can quickly focus on why people had negative, neutral, or positive experiences. The AI summary automatically updates to highlight what's working well or what needs improving, depending on what you're looking at.
Click to filter for feedback related to different reasons why end-users had poor or great experiences, to get more detailed insights from their free text comments. 
 

๐Ÿ” Find feedback relevant to you more easily with the new filter panel

Weโ€™ve made it easier to find feedback relevant to your work with the new filter panel on the left. If youโ€™re responsible for a specific Country or Service, you can filter to see only the feedback related to those area(s), and navigate between different filters in a few clicks.
You can filter feedback using context data filters (e.g. Services, Assignment Groups, Channels), as well as response data filters (e.g. Score, Lost Time). The number of comments received is shown in brackets next to each data value, sorted from most to least comments.
 

๐Ÿ”ง Personalize what and how data categories are shown in the filter panel
You can also change the order and visibility of categories in the filter panel to more easily access your commonly used data filters.
Click 'Edit categories' and drag to rearrange, or toggle on/off to make categories visible/hidden for each measurement area. For example, you can move categories like Country or Assignment Group up if you use those often, or hide categories that you donโ€™t need.
Note: Your selections will only affect your own filter panel view, not that of other users in your organization.


๐Ÿท๏ธ Organize and tag groups of comments for efficient analysis 
Tagging groups of related comments is now easier than ever. Click to select multiple comments related to the same issue and tag them at one go. You can revisit tagged comments anytime from the 'Filter by tag' menu.

Note: Only users with an Administrator role can create new tags or edit existing tag names. Tags and the tagged comments can be seen by all users in your organization, regardless of role. 
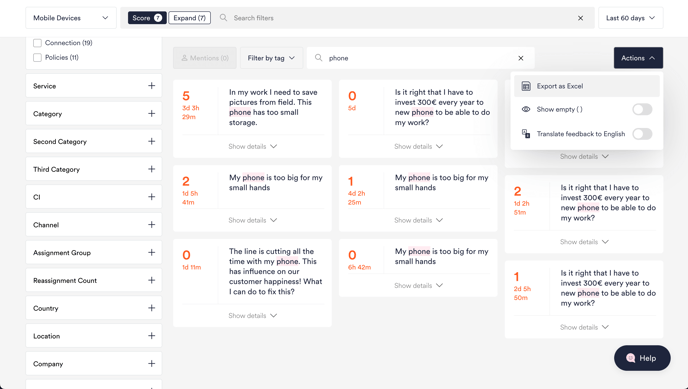
 

๐Ÿ”Ž Limit data downloads to responses that match data filters and search results

If you download data for manual analysis, you'll now find it easier to limit what the download contains. Your downloaded Excel file will only contain the responses you see on screen on the Feedback page. This means that only responses that match any selected data filters, tags, as well as keyword search results will be included in the file.

To download all responses in your filter set (including those without free text comments), toggle on 'Show empty' before clicking 'Export as Excel'.


๐Ÿ“Œ Pin important data on compact comment cards

Want to keep specific contextual information about each comment or response visible at a glance even in the compact view? From the Actions menu, click 'Edit pinned fields' and toggle on the fields that you want to see on the compact comment cards.
The pinned fields will be shown prominently all the time, so you don't need to click 'Show details' to see that information. Tags are pinned by default, but can be toggled off if you wish.