Only HappySignals users with an Administrator role can create Live Screens.
You can create a Live Screen either from scratch under Settings, or from an existing Shortcut you have saved before.
Create Live Screen from Settings
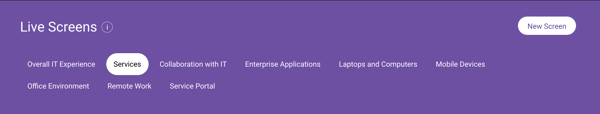
1) Go to Settings and select "Live Screens" from the left navigation panel.
2) Select the Measurement Area you want to share live data about and click "New Screen". Note: Only the Measurement Areas your organization has activated will be available for selection here.
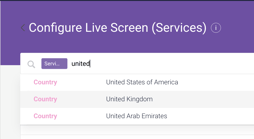
3) Add filters to create the data set you want to use for this Live Screen by searching in the filter search box. If you are adding many filters for your Live Screen, we recommend creating a Shortcut first, then copying that Shortcut to a Live Screen directly.
In this example, we shall add United Kingdom as a Country filter.
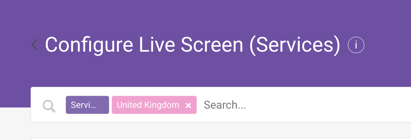
Note: The Measurement Area you selected in Step 2 is already pre-selected as a filter. You cannot remove this filter unless you restart from Step 2's Measurement Area selection.
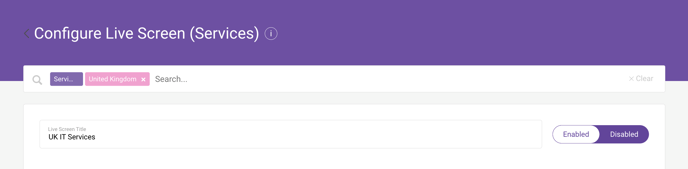
4) Give your Live Screen a title, e.g. "UK IT Services".
5) Add data you want to show by dragging contents from the column on the right.

Add, remove, and reorder the slides until you're happy with it. The Live Screen will show the slides in a rotating slide show based on the order you set here.
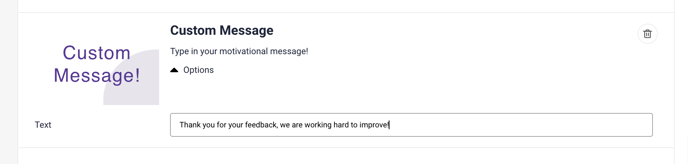
6) You can even add a custom message to the Live Screen. For example, you may want to thank your end-users for giving feedback about their IT experiences (and indirectly encourage more end-users to give feedback too!)
7) Save the Live Screen. Now you can preview your Live Screen by clicking "Test Screen". You can also copy and paste the Screen Link generated at the top of the page to share the screen preview with your colleagues.
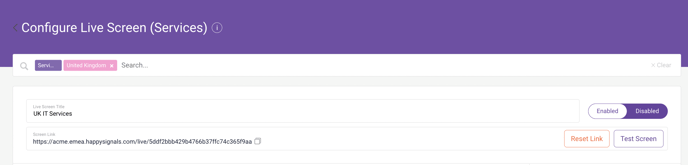
If you want a new URL for your Live Screen click "Reset Link" – the old link will no longer work.
8) You can still edit the Live Screen after saving. Just add, remove, or reorder the slides as before and click "Save Changes".
Create Live Screen from Shortcut
1) From the Shortcuts section in the Measurement Area dropdown on the Experience page, or at the bottom of the Dashboard page, choose the Shortcut you want to create a Live Screen from. From the three-dot menu, click "Copy to Live Screen". The filters from the Shortcut will be used as a base for your new Live Screen.


2) Configure your Live Screen by following the same Steps 4-8 from above.
Questions? Comments? Chat or email support@happysignals.com