Watch this video of what's new in Improve
In this release note:
- Changes to existing features
- New: Communicate IT's impact on experience and productivity
- New: AI-powered feedback summary
- New: Set Objectives and Targets systematically
- New: Themes
- Others
Changes to existing features
- Targets moved from Settings to Improve section: We've moved Targets to the Improve section so that you can find all actions related to improving in one place. We've also made target-setting more flexible and intuitive, find out more below.
- 'Save as Shortcut' and 'Improve' now under Actions menu: The new Actions menu next to the search bar on the Experience page is where you can save a filter set as a shortcut, create an Initiative/XLA to improve, or set a target for your selected filters.
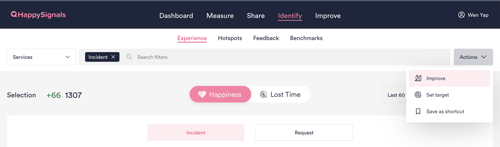
- Save Shortcuts from measurement areas: You can now save a measurement area as a Shortcut even without any additional filters selected on the Experience page. You can then share the shortcut link with others to look at data from that area.
- Experience page data will now be compared to Baseline by default: All data on the Experience page will now be colored green or red vs. your organization baseline for the selected Measurement Area. Previously, data on this page compared to 'Target' by default.
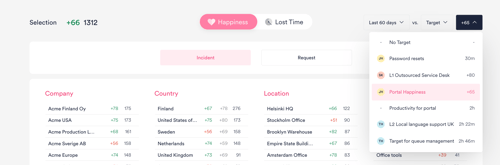
- Choose between different Targets to compare data to: You can now select which Target you want to compare your data to on the Experience page, if you have set multiple different targets.
New: Communicate IT's impact on experience and productivity with the Improve Overview page 🆕
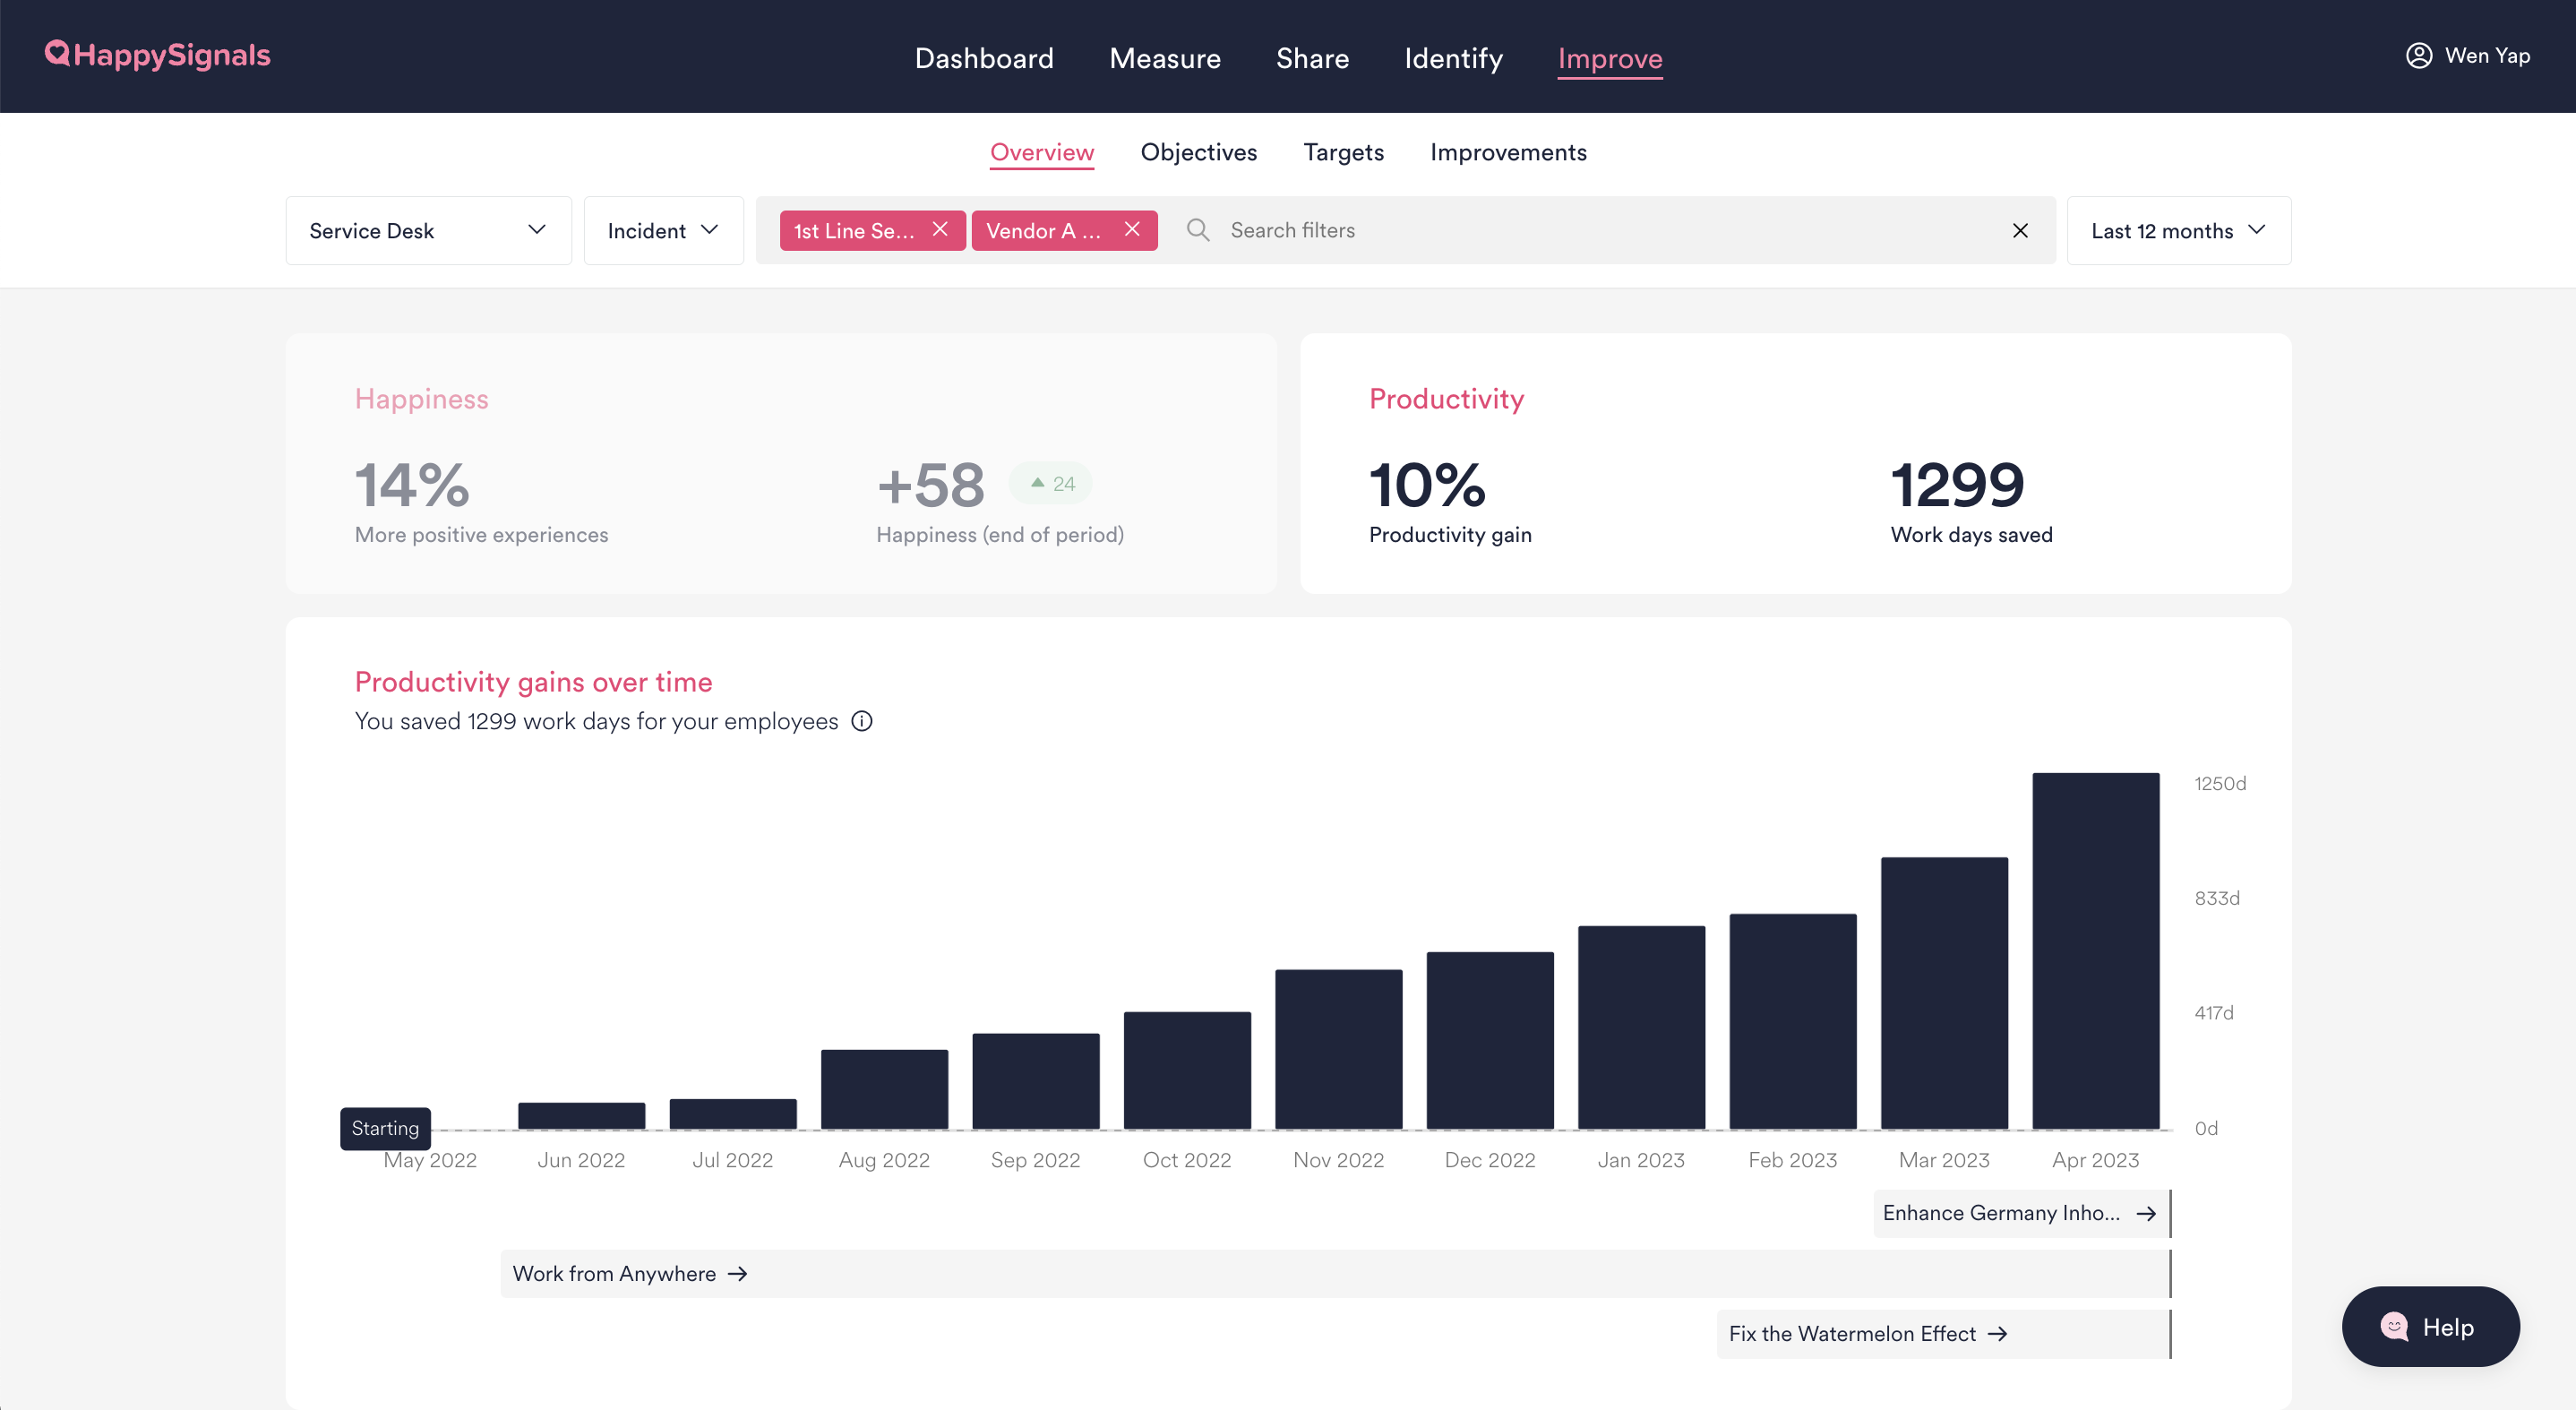
The new Improve Overview page is where you can see the long-term experience and productivity improvements IT has achieved in your ITXM journey. Depending on your role and focus, you can look at IT's impact on broad areas like IT Incidents or Laptops and Computers, or more granular areas like specific regions or assignment groups.
Celebrate your experience outcomes, acknowledge the teams involved and communicate what IT has achieved to your stakeholders! On this page, you can:
- View long-term improvements achieved in your focus area: Select different measurement areas, shortcuts, or filters to see how experiences and productivity in those areas have improved over longer periods, like the Last 12 months or All Time.
- Quantify productivity gains: See the productivity gains and work days saved by IT in the time period you're looking at. Productivity gain calculations are based on the cumulative change in Lost Time compared to the first month of that period. Learn more about how productivity gains are calculated
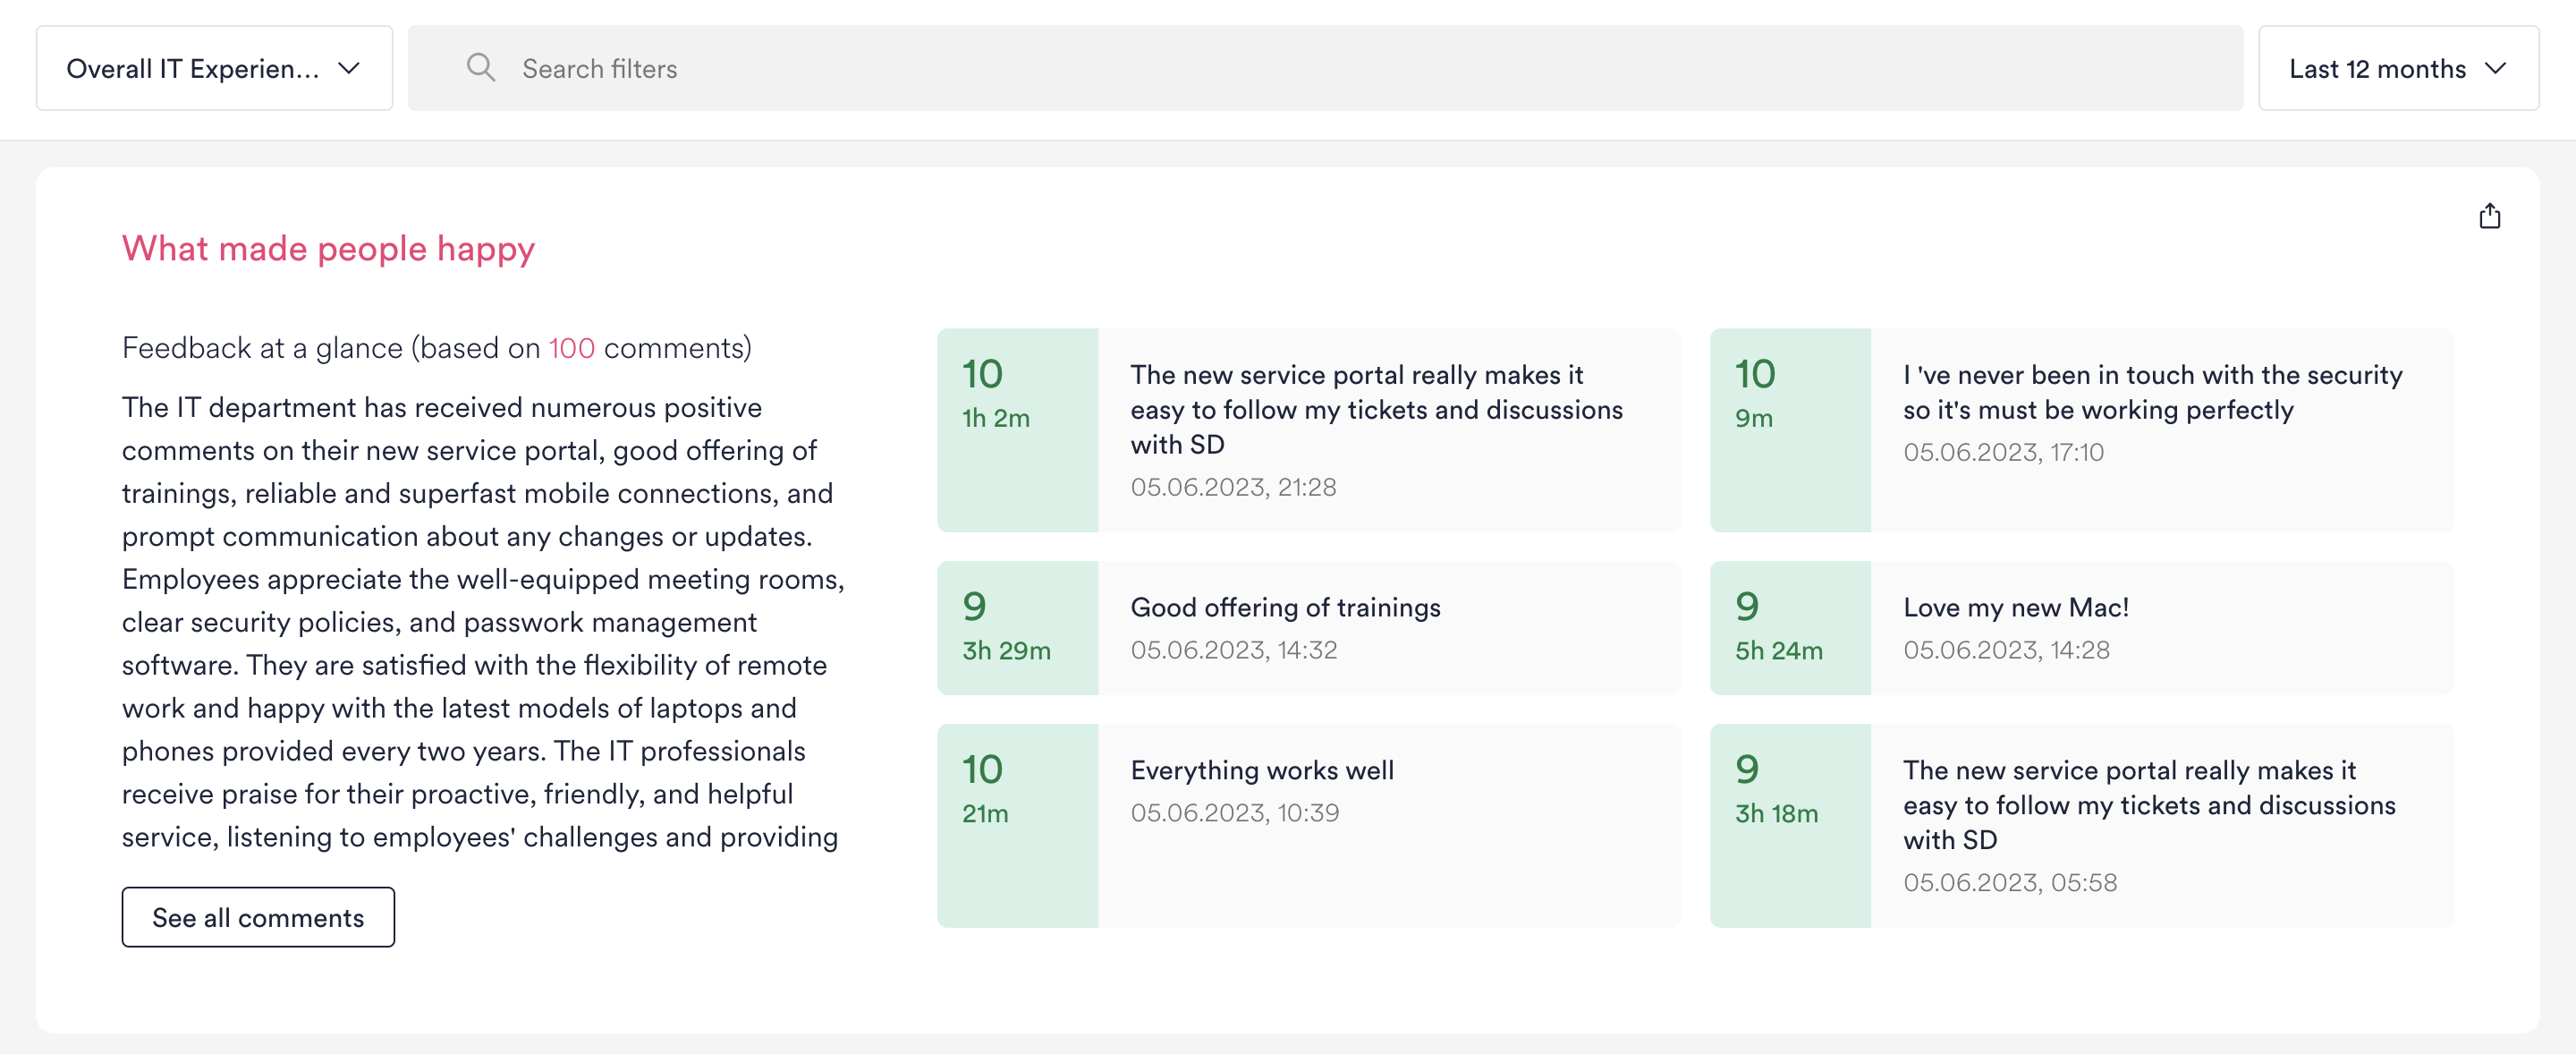
- See at a glance what made people happy: Quickly understand the positive comments people are giving about IT by reading an AI-powered summary, and see the top themes and areas where Happiness is trending up.
New: AI-powered summary of positive feedback 🆕
Quickly understand the positive open text feedback employees are giving about IT with our new AI-powered summary on the Improve Overview page. It summarises what people are saying from hundreds of positive comments, so you don’t need to spend hours reading them!
New: Improve systematically with Objectives and Targets 🆕
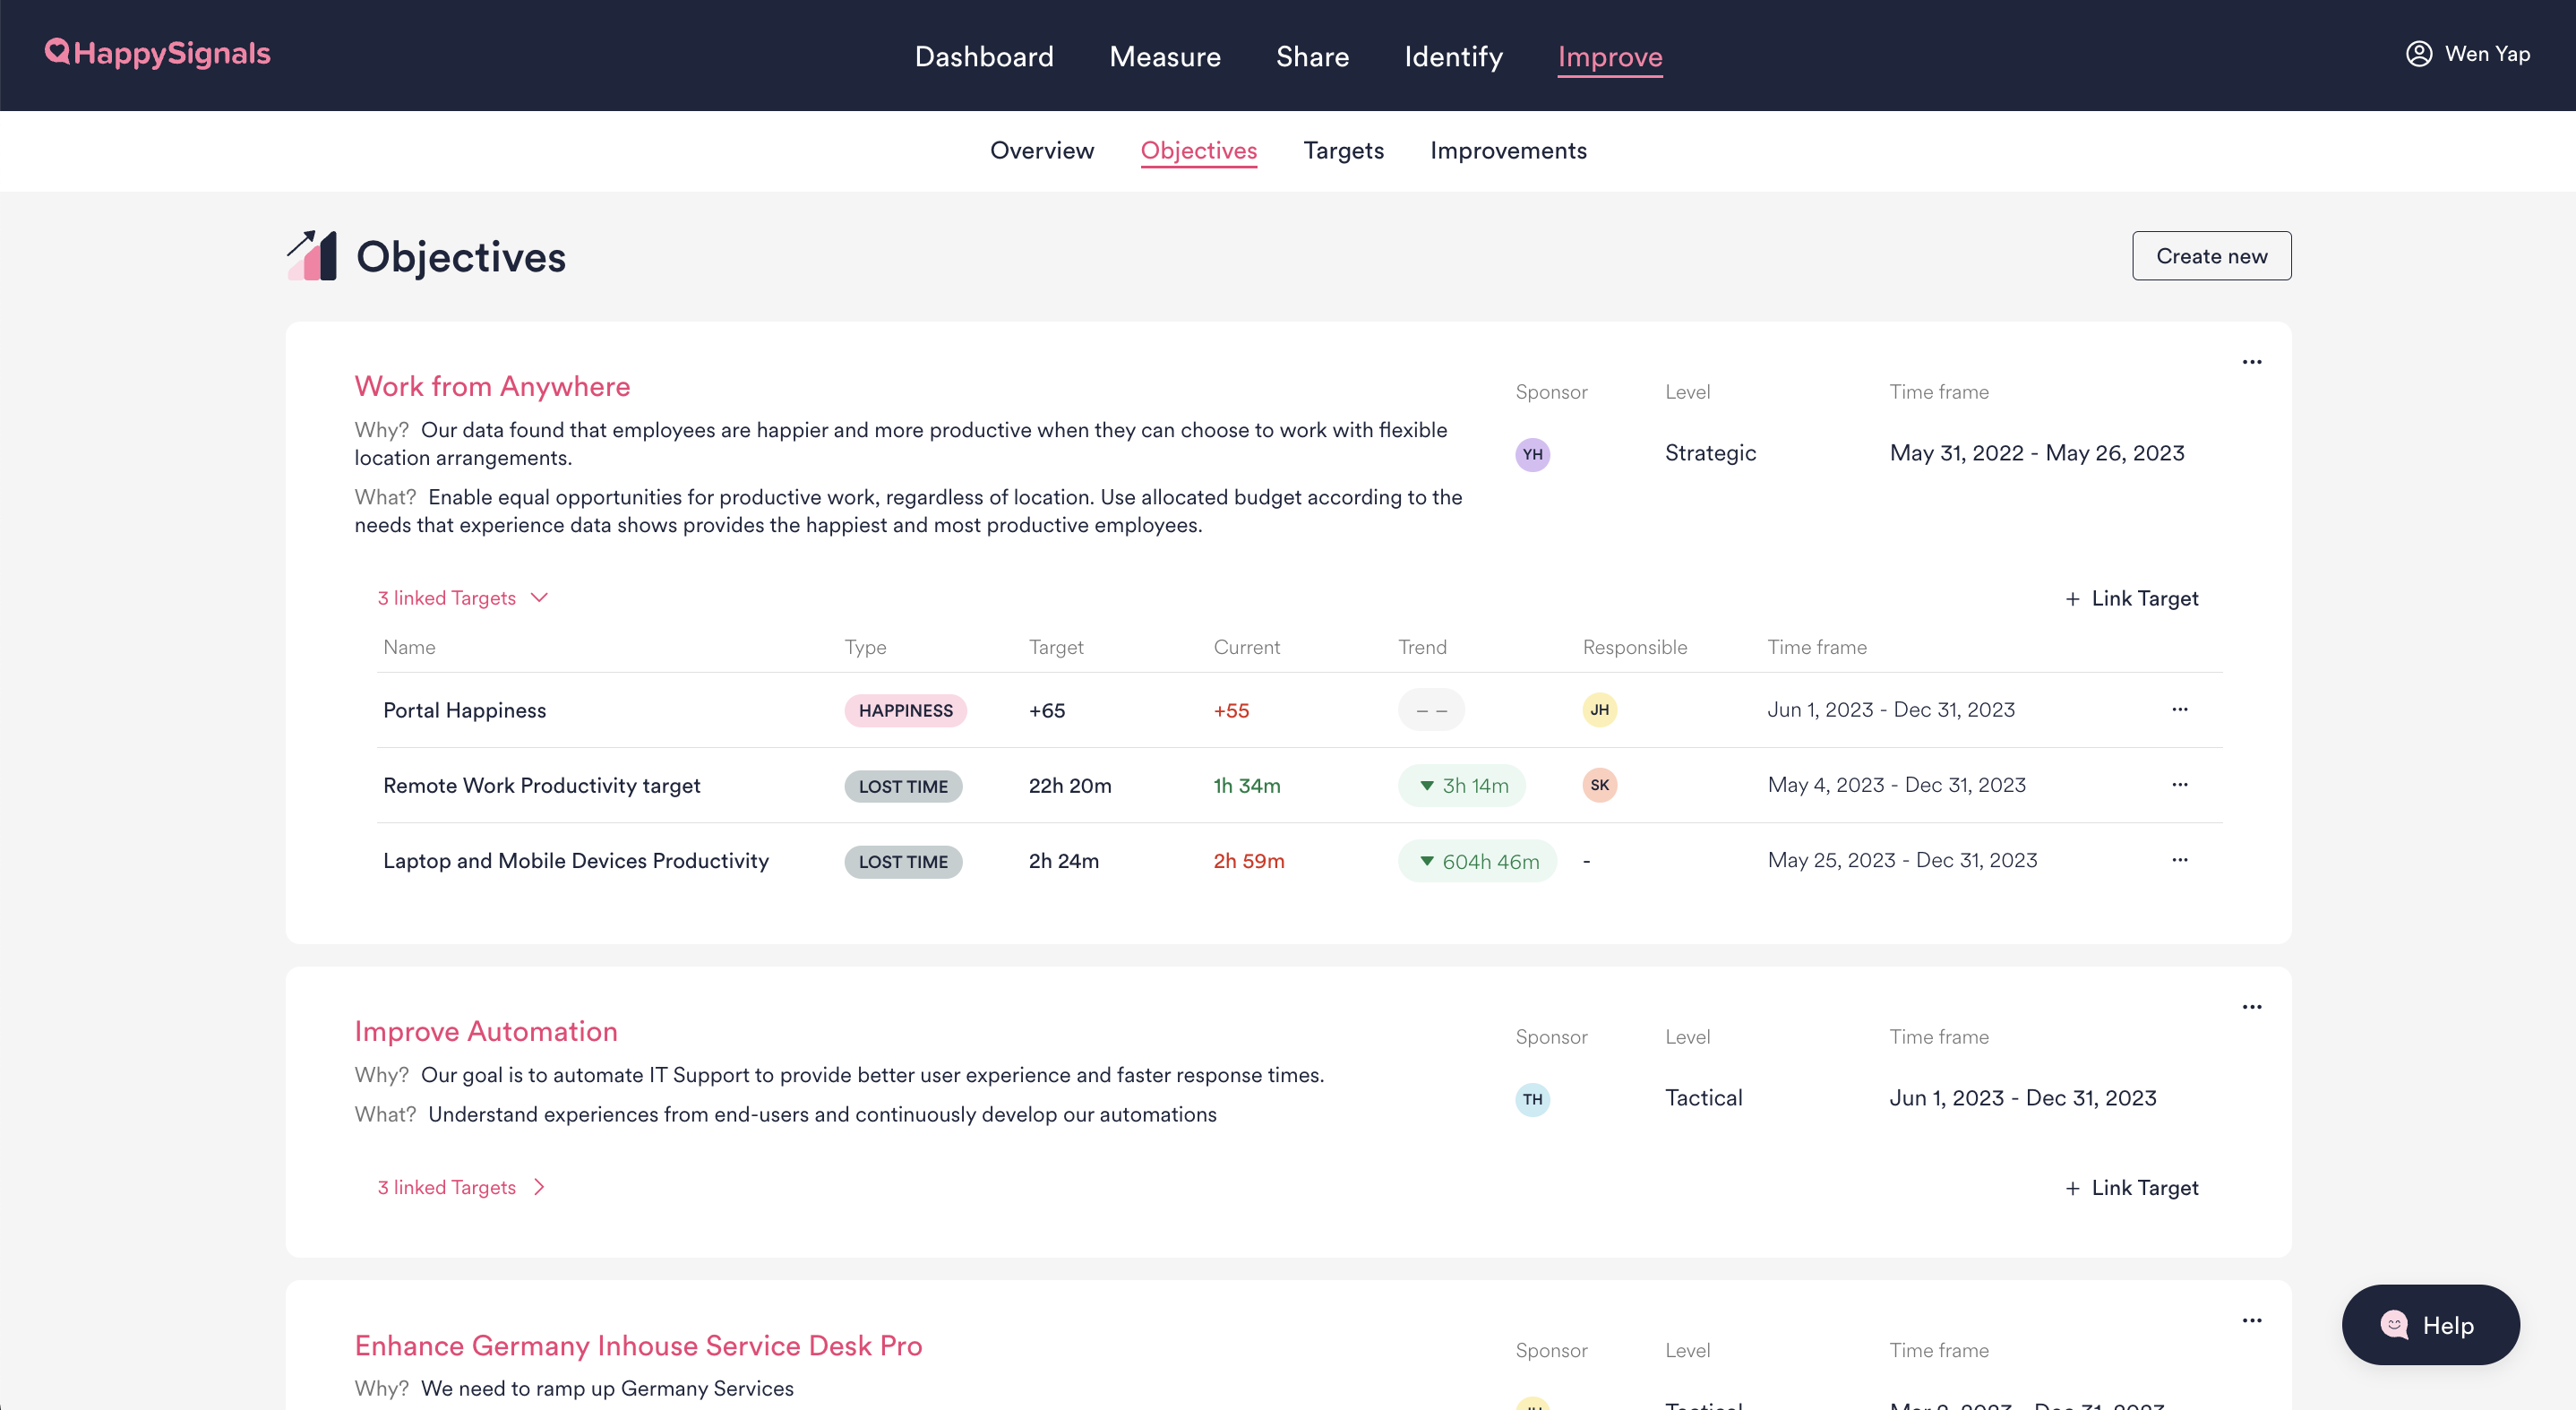
We've added new features and made some changes to help IT approach improving systematically:
- Set objectives: Set clear objectives and make them visible on the platform to keep IT teams aligned around a common focus, driving coherent action without micro-management. Learn more about setting objectives
- Link targets to objectives: Link quantifiable metrics for success to strategic objectives to drive alignment in your teams' improvement actions.
-
Set granular Happiness and Lost Time targets for different focus areas: Beyond setting targets for broad measurement areas, you can now also set granular targets for specific countries, services, assignment groups, or any filters you choose.
- See how you're doing compared to your target: Click on any target on the Targets page and you'll be directed to the Experience page, where the filters from that target will be pre-selected and the data colored green or red compared to the target.
Note: Only HappySignals Admin users can create or edit Objectives and Targets. All users can view them.
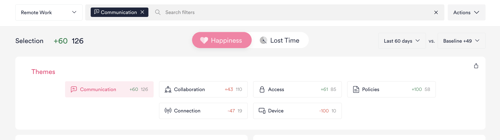
New: Themes 🆕
We're introducing Themes to help you understand experiences related to e.g. Speed, Communication, Connection, etc in one click. The categorization of response data into different Themes is based on the content of employees' survey responses.
- On the Improve Overview page, you can see at a glance the Top Themes where Happiness is trending up most.
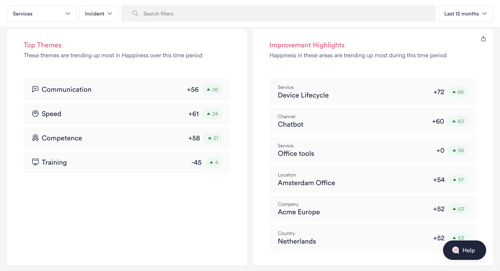
- In the Identify section, use the Themes filters to drill down into data on the Experience and Feedback pages
Other changes
- Time to resolve card hidden when viewing Proactive IT areas: We've now hidden the Time to resolve card from the Experience page when you are viewing Proactive IT areas (such as Remote Work), as that data is only relevant for Ticket-based areas.
- Deprecated Response Quality section in Settings: We've hidden this section from Settings as all the information previously shown there has already been available in the Measure section itself.