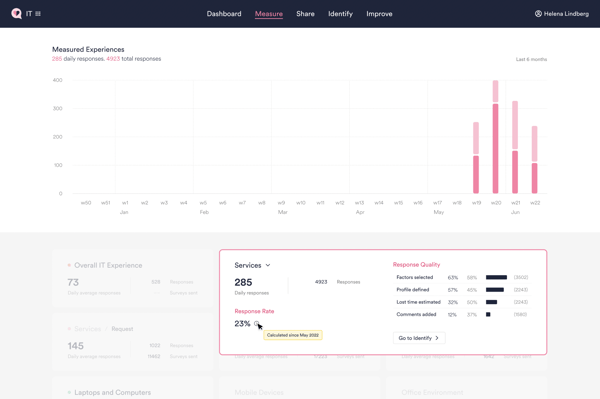
Added response rates on Measure page
- Response rates shown for each Measurement Area: Click to expand any Measurement Area card to view its response rate.
- Response rates will only be shown if your organization has enabled response rate analysis (only available to ServiceNow customers for now). Find out how to enable response rate analysis.
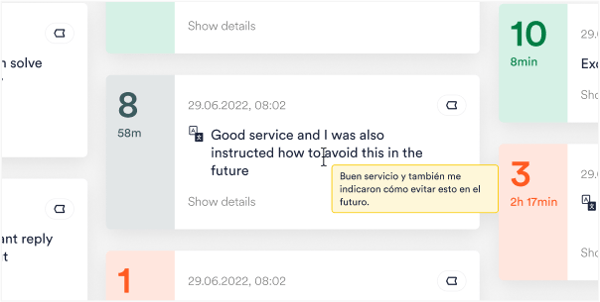
Auto-translations for non-English feedback
- Automatic machine translations of non-English feedback to English:
Toggle translations on or off on the Feedback page.
-
This setting is not global, i.e. it only translates the feedback in your view, not for other HappySignals users in your organization.
More support for drilling down into your data on Reports page
-
Drag to Zoom on graph: Maybe you notice an unusual change in Happiness or Lost Time on the graph that you want to investigate? Click and drag on the graph to zoom in to data within the selected time frame.
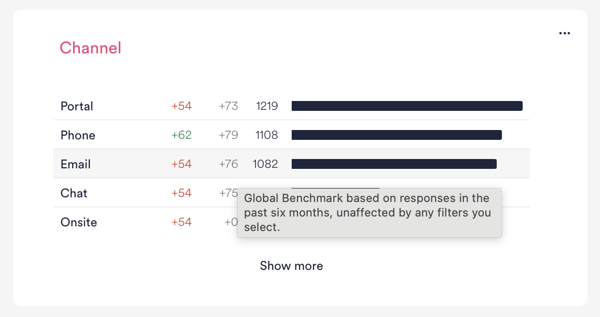
- Compare your data side by side with benchmarks: To facilitate comparing your organization’s data for different Channels, Countries, and IT Support Profiles with HappySignals Global Benchmarks in one view, we now show the benchmark data (grey numbers) next to your own data.