Why does Happiness graph show scores in the future?
"Are you able to predict the future?", a customer of ours recently asked. No, unfortunately we're not quite there yet... :)
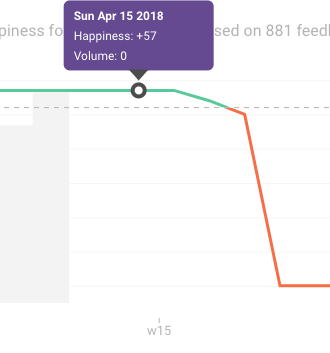
In the Reports page, if you have selected to view the current month whilst in the middle of it, you might see the trend graph showing Happiness scores beyond today, as shown below.

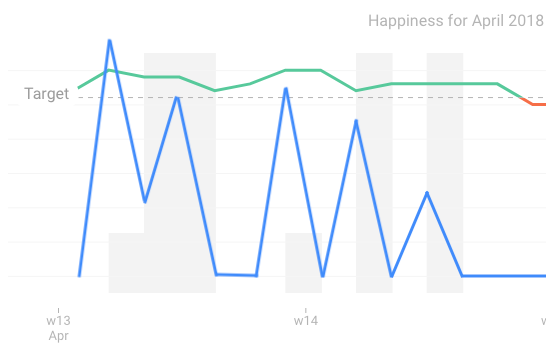
The grey bars show the feedback volume for each day, and you see when the feedback ends, the Happiness line continues on, until after a while it drops to zero.
"So, what is happening here?"
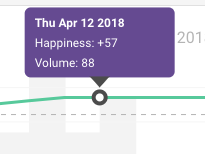
In the graph, Happiness and feedback volume are shown for each day. When you mouseover a certain day, a purple text box pops up showing these daily values. I guess you've seen this before.

The daily Happiness scores are calculated as weighted rolling averages from previous seven days. This is done to "smooth out" the graph, in other words to avoid having big dips and spikes, if the feedback volume suddenly and significantly changes.
If this wasn't done and supposing you would some days get very little or no feedback (e.g. during weekends, public holidays etc.), your Happiness could be jumping all over the place. Instead of the green line, you would see something like the blue line below.

Also, using a rolling average helps you to have statistically more meaningful amount of data, especially when you use filters to drill down to smaller and smaller sets of feedback, like just one service for one location.
"Ok, but why do I see the graph continue to tomorrow and beyond?"
This is because currently the graph treats all days the same way. It doesn't know if a particular day is in the future or not, and just wants to keep drawing the Happiness line based on whatever data is available.

The reason for this approach is purely to keep the application simple, easy to maintain and most of all, practical. We use the same widget to show whatever time period you want to see, so it needs to be very accommodating.
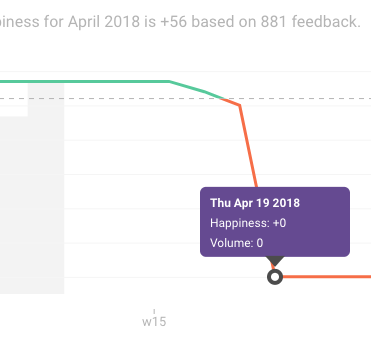
Because of the rolling average, even though you won't have any feedback for the next seven days, for tomorrow you do have data from the previous seven. And one day at a time, you will have one day less counted towards the score. After a week, there is no data from previous days, and the graph flatlines to +0 Happiness.

At least it's still a +0... :)