Trend helps you focus on long term / high-level development, not the daily changes. The variance may be quite big on short periods of time, because of the smaller response volumes on Happiness and Lost Time.
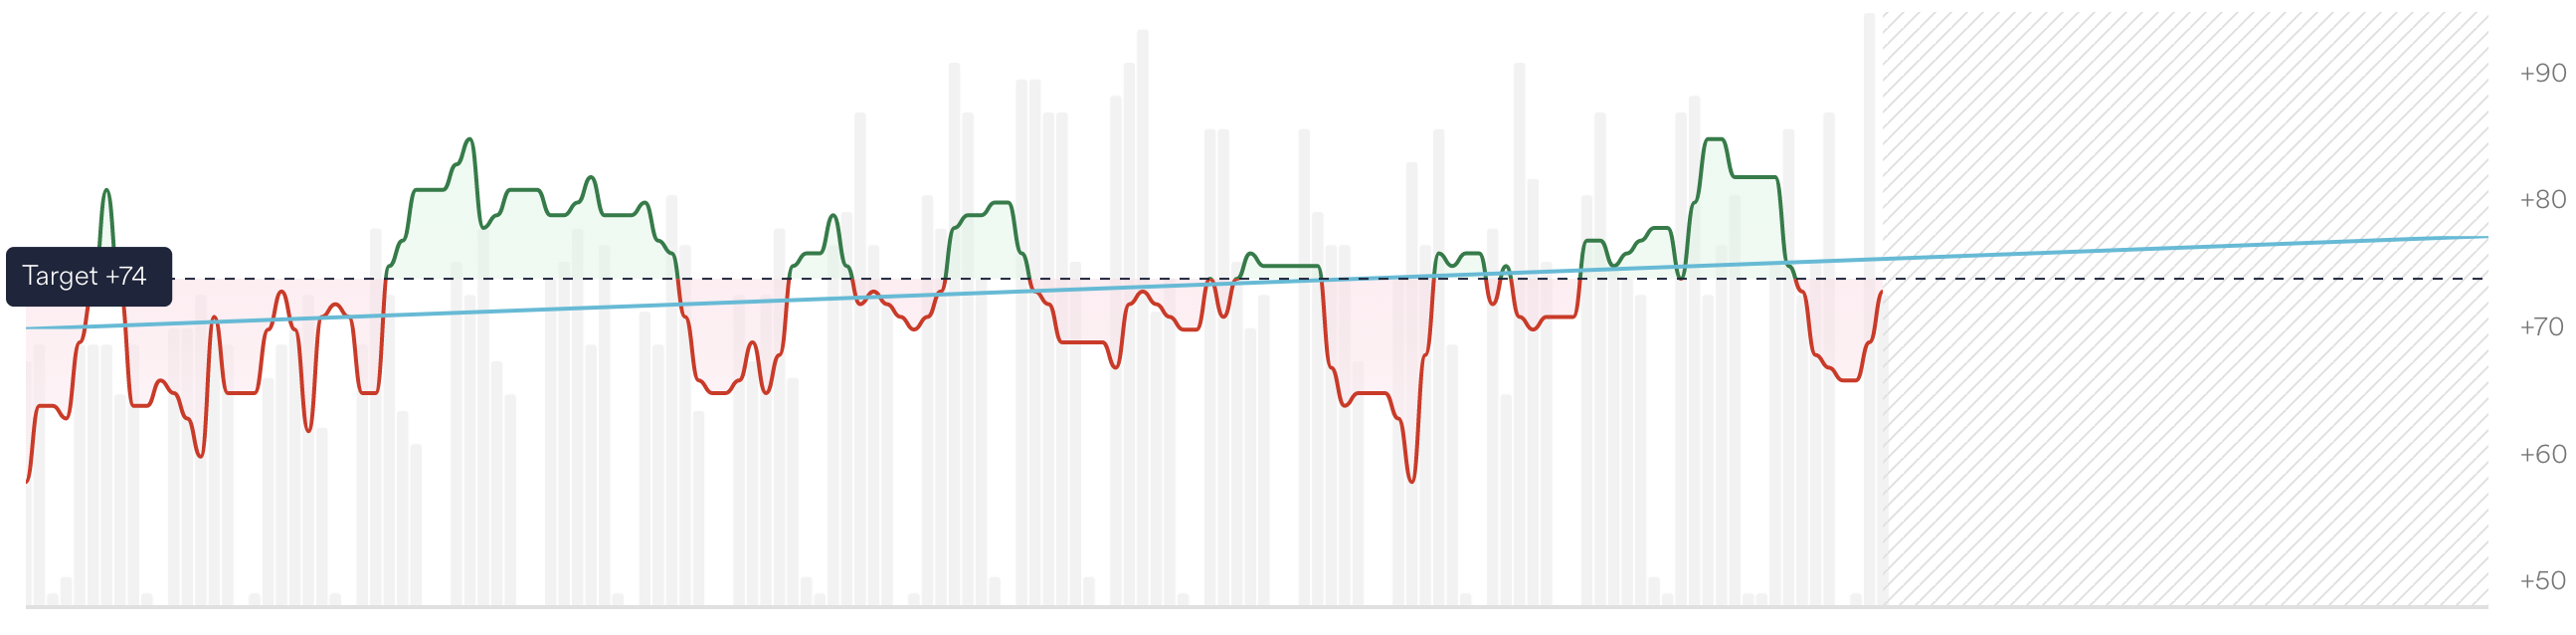
By showing the trend line on the timeline graph, you can also see when you will reach your target by keeping your current trend, or when you will fall under the target.
How is the trend line drawn?
The trend line seeks to reflect overall progression of Happiness/Lost time, with less emphasis on daily variations.
The trend line shown is the straight line that best fits the curve of daily Happiness/Lost time values. The platform uses the ordinary least squares method to find the best trend line fit from the daily values. The daily values themselves are 7-day weighted moving averages (weighted by volume).
How is the trend value calculated?
The trend value is calculated from the gradient of the trend line drawn between the start and end of the time period you're looking at. Hence it reflects, on a high level, how Happiness / Lost time has changed during this time period.
Note! The trend value is not the same as the absolute difference in daily Happiness/Lost time values between the start and end of the time period.
You can see the current trend value at:
- Experience page, in the main graph
- Dashboard, in "IT at a glance" for each Measurement Area
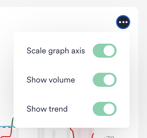
How to use trend?
Use the trend value and line to understand if things are going in the right direction, and how fast! You can check the overall trend values per measurement area on the Dashboard, or look at the trend line and value for your filtered data on the Experience page graph.
Note that the trend is more reliable when response volume is higher. The trend calculation may be unreliable if your filter set has only a few responses, or if this time period has only a few days when responses were received.
Hence, always check the volumes the trend calculation is based on. Unreliable or surprising trends can happen particularly when choosing a time period with only a small number of past days and a large number of future days (such as "This month" at the beginning of a calendar month), or when there's a wide gap of zero volume days between low volume days at one or both ends of the selected period.