Changes to existing features
- The Reports page is now called Experience.
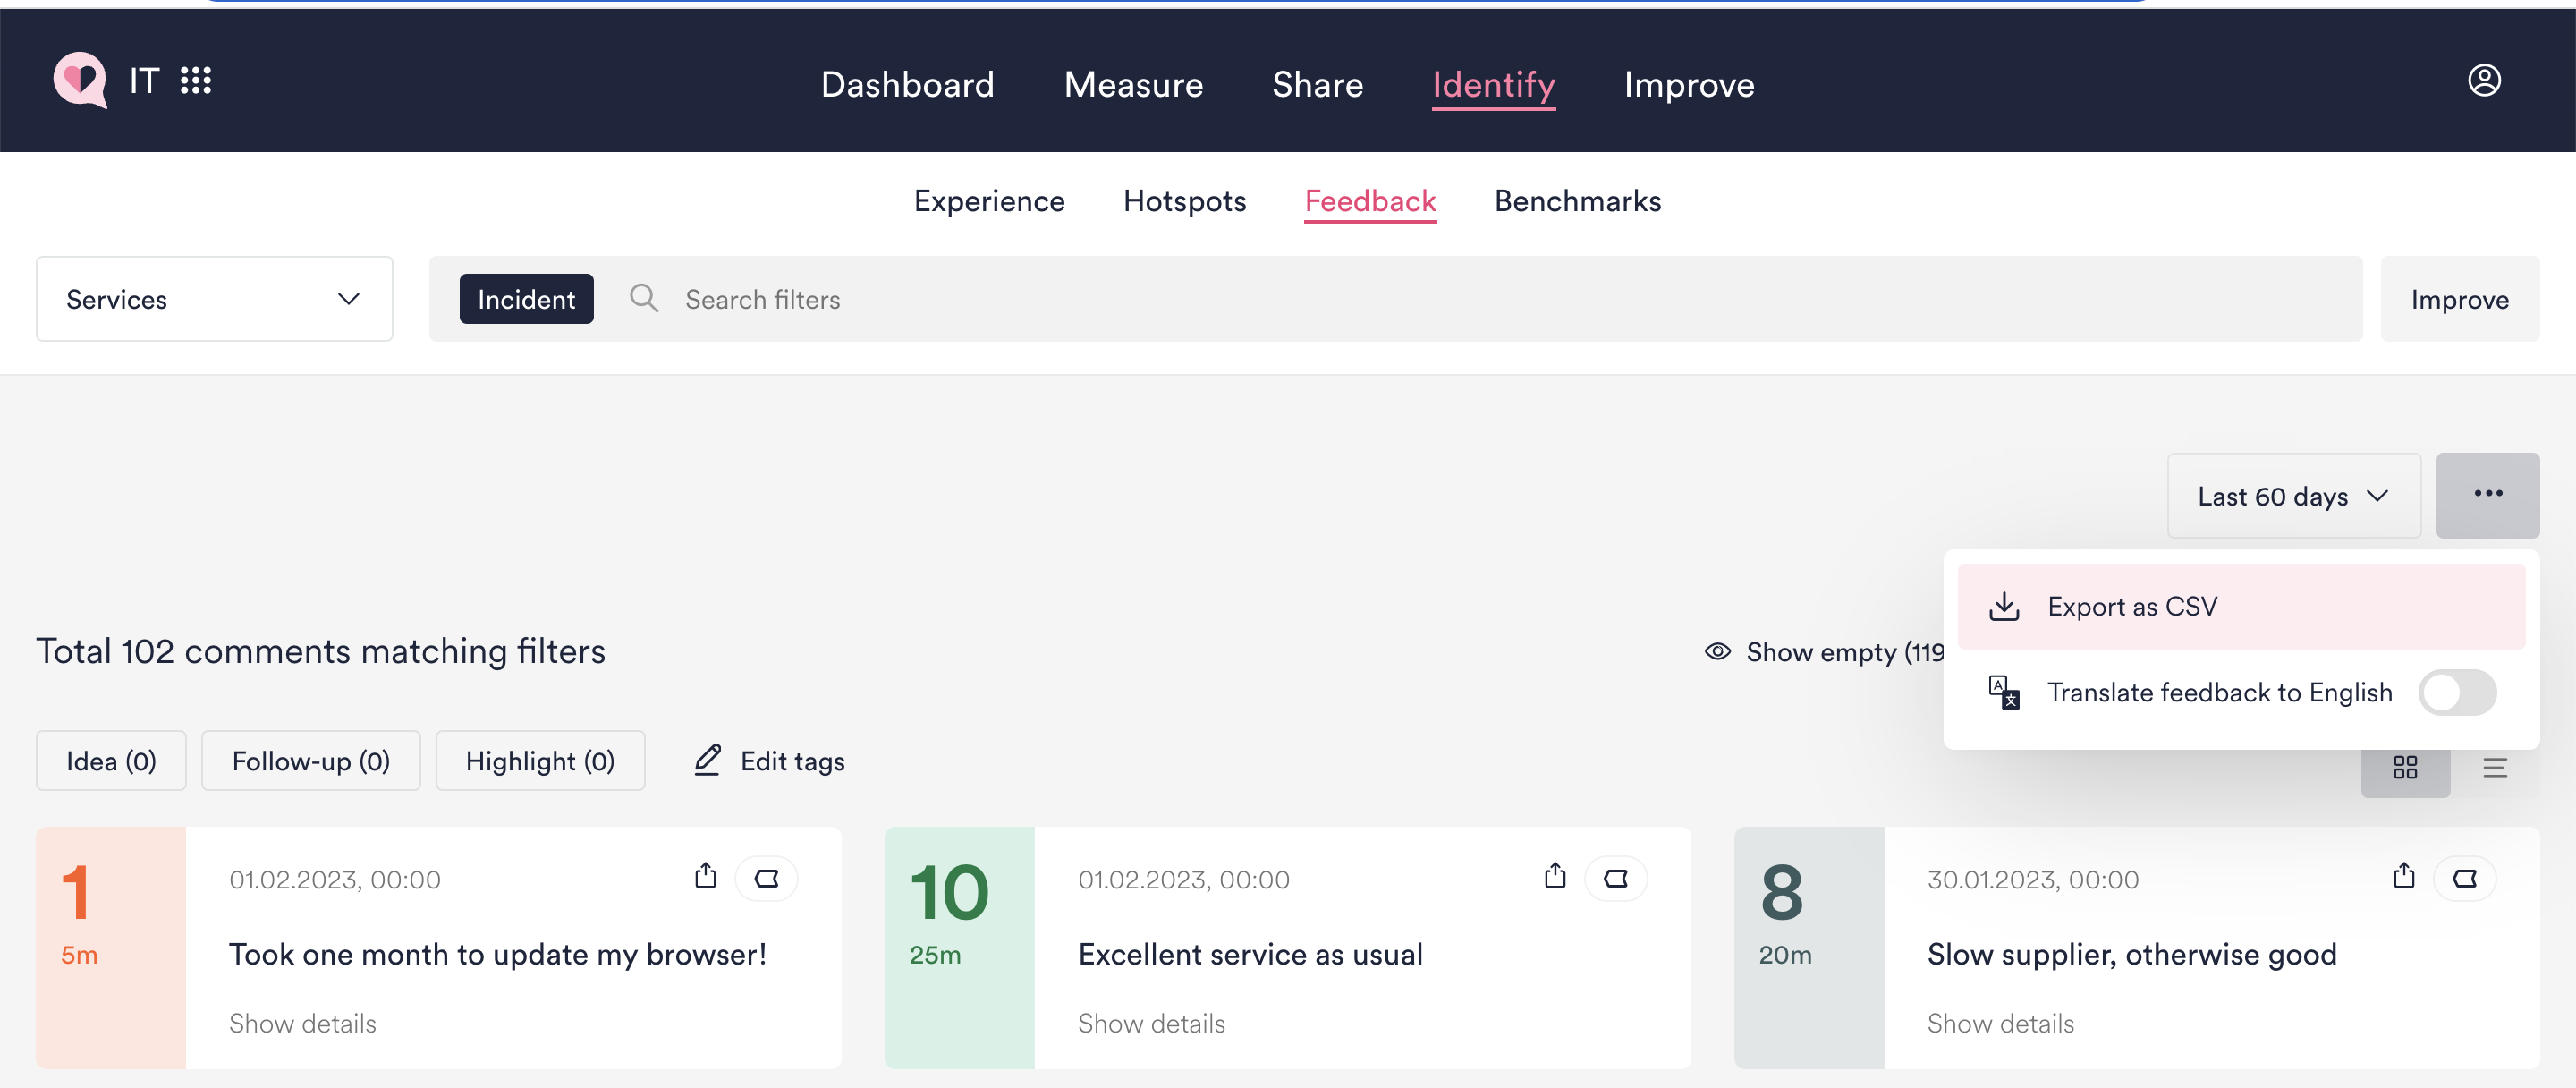
- Export data as CSV only via Feedback page: We've removed the "Export as CSV" button from the Experience page (previously Reports page) to make way for new analytics tools. ❗️You can still access the export data function as usual on the Feedback page.
- Time zones standardized to GMT/UTC for all users: We've now standardized time zones to remove discrepancies in data between people using the platform from different parts of the world.
For instance, if two IT workers are looking at HappySignals data for the last six months, one in the US and one in India, they will now see the same numbers and response volumes. In the past, there may have been tiny discrepancies due to time zone differences. - Data with unknown fields are now shown in the Experience page (Unknowns were previously hidden). This makes it easy as well to identify fields where your data quality can be improved.
New in Identify 🎉
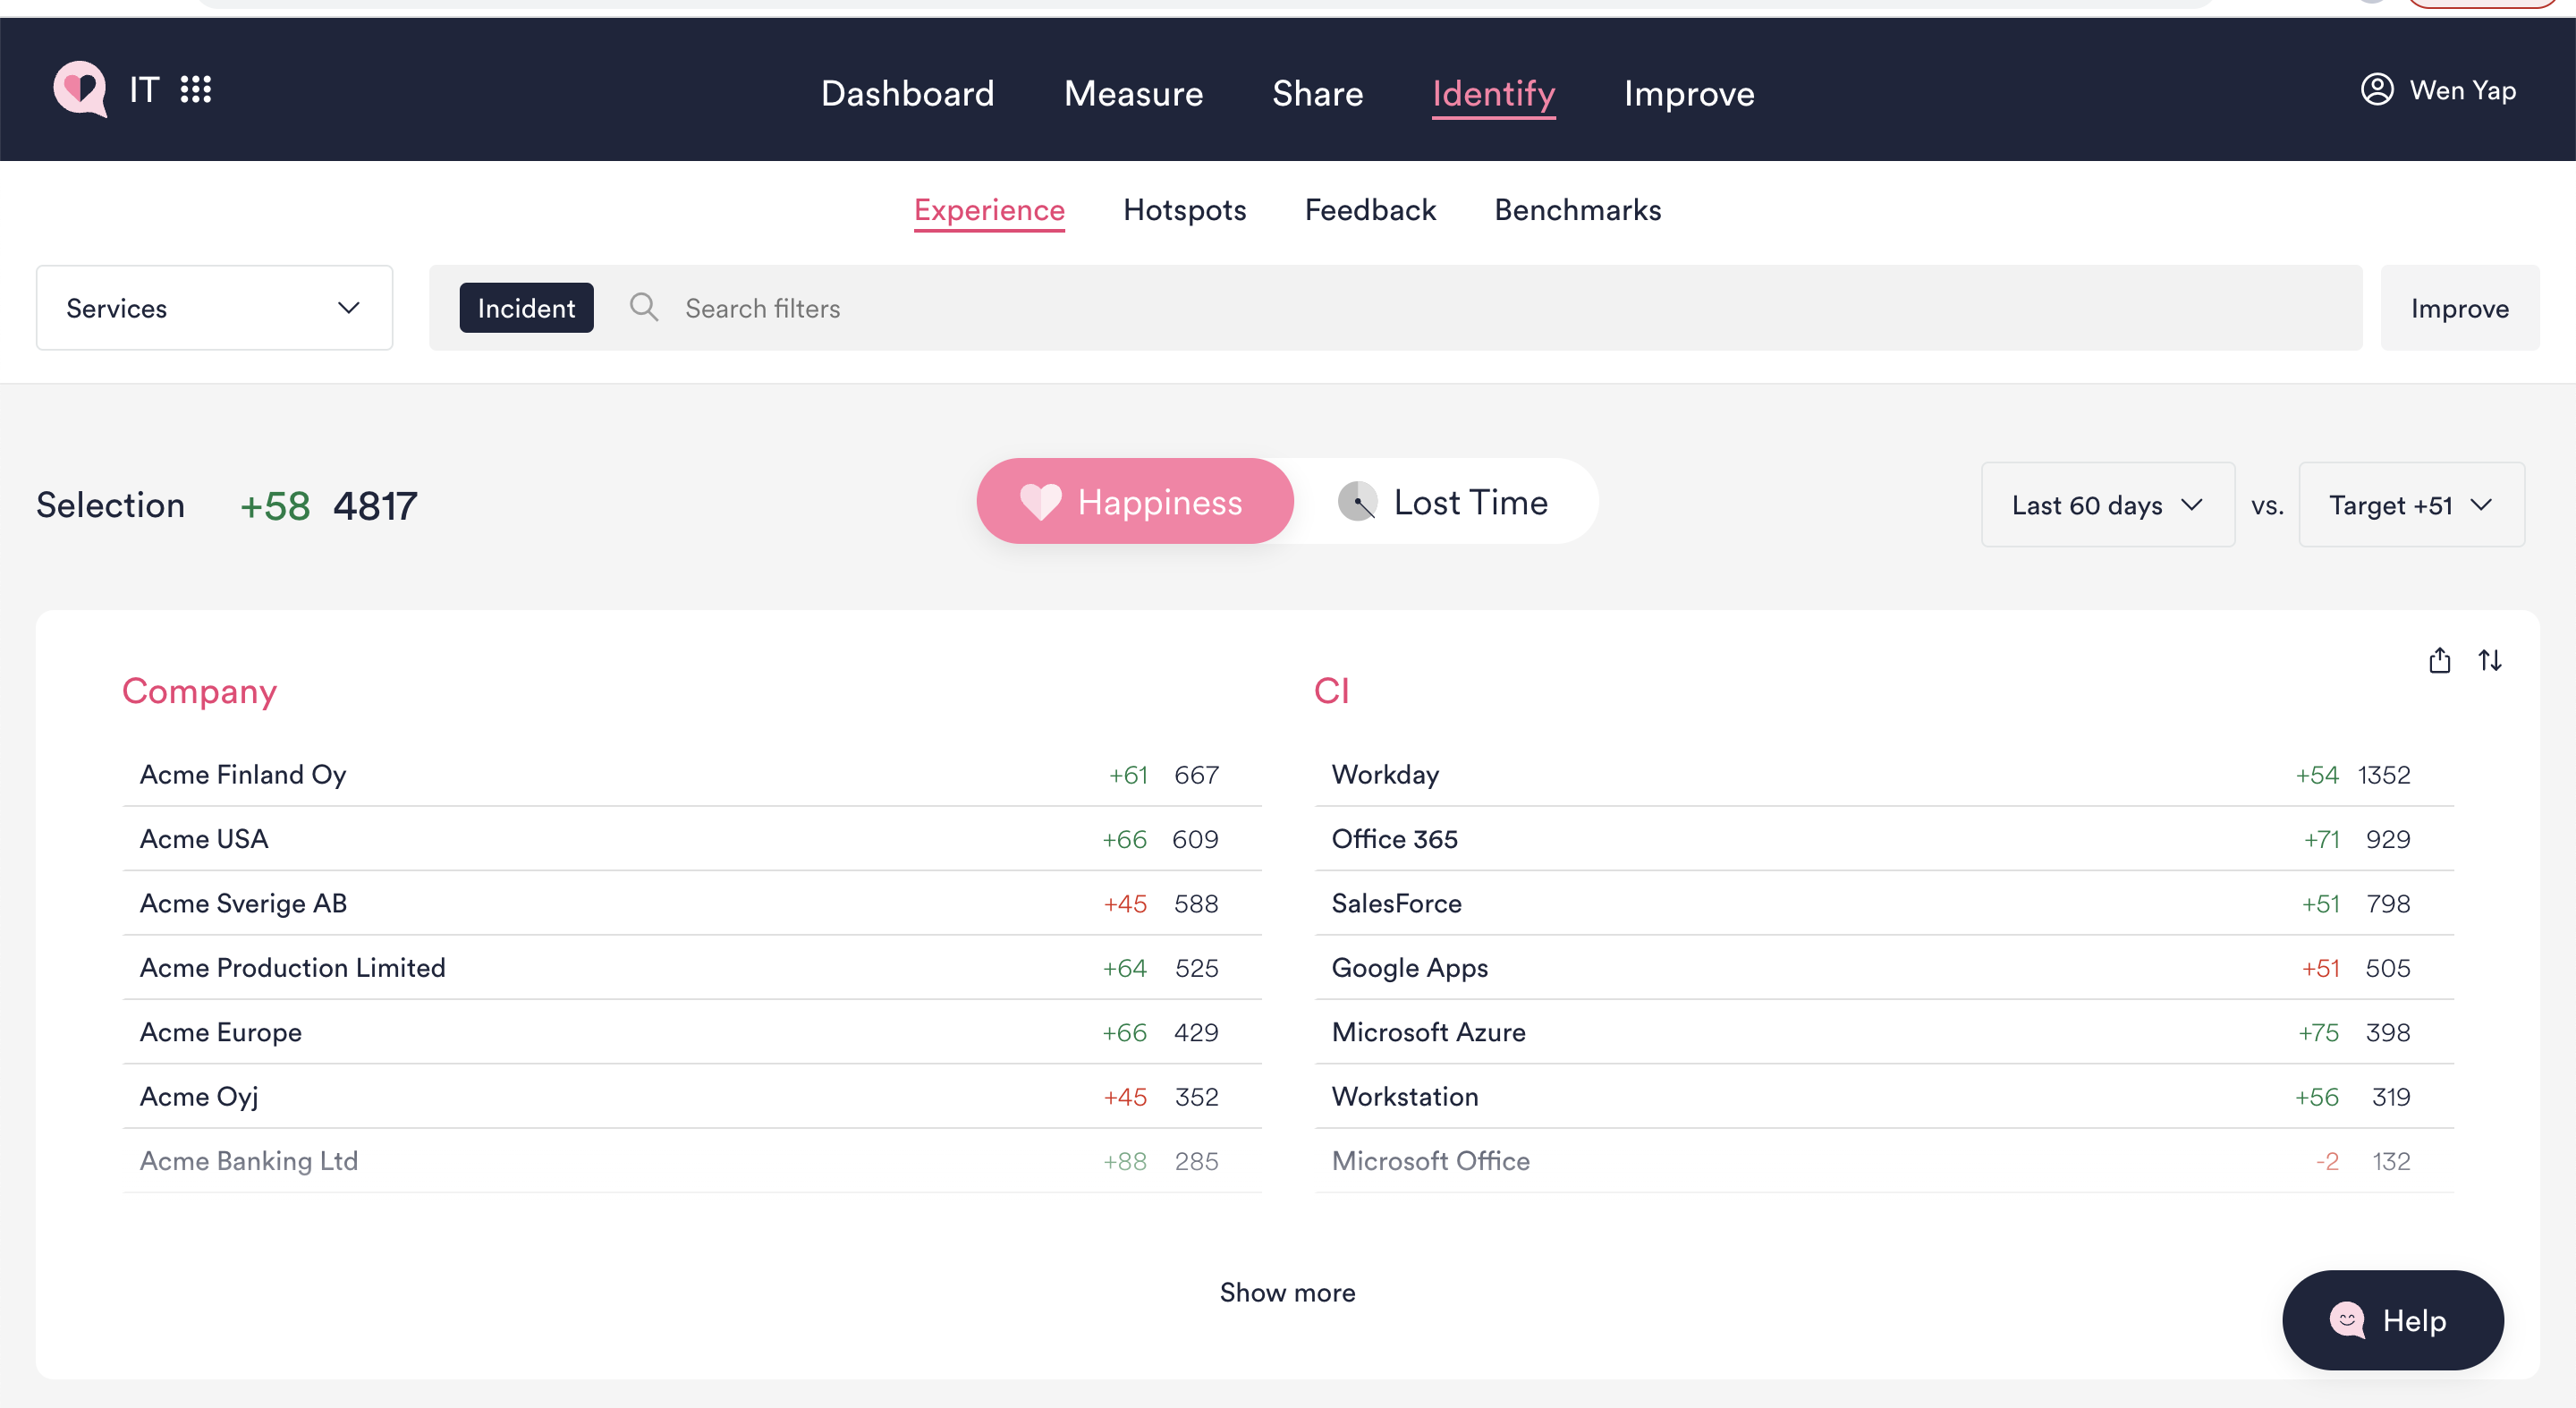
New ways to compare data on the Experience page
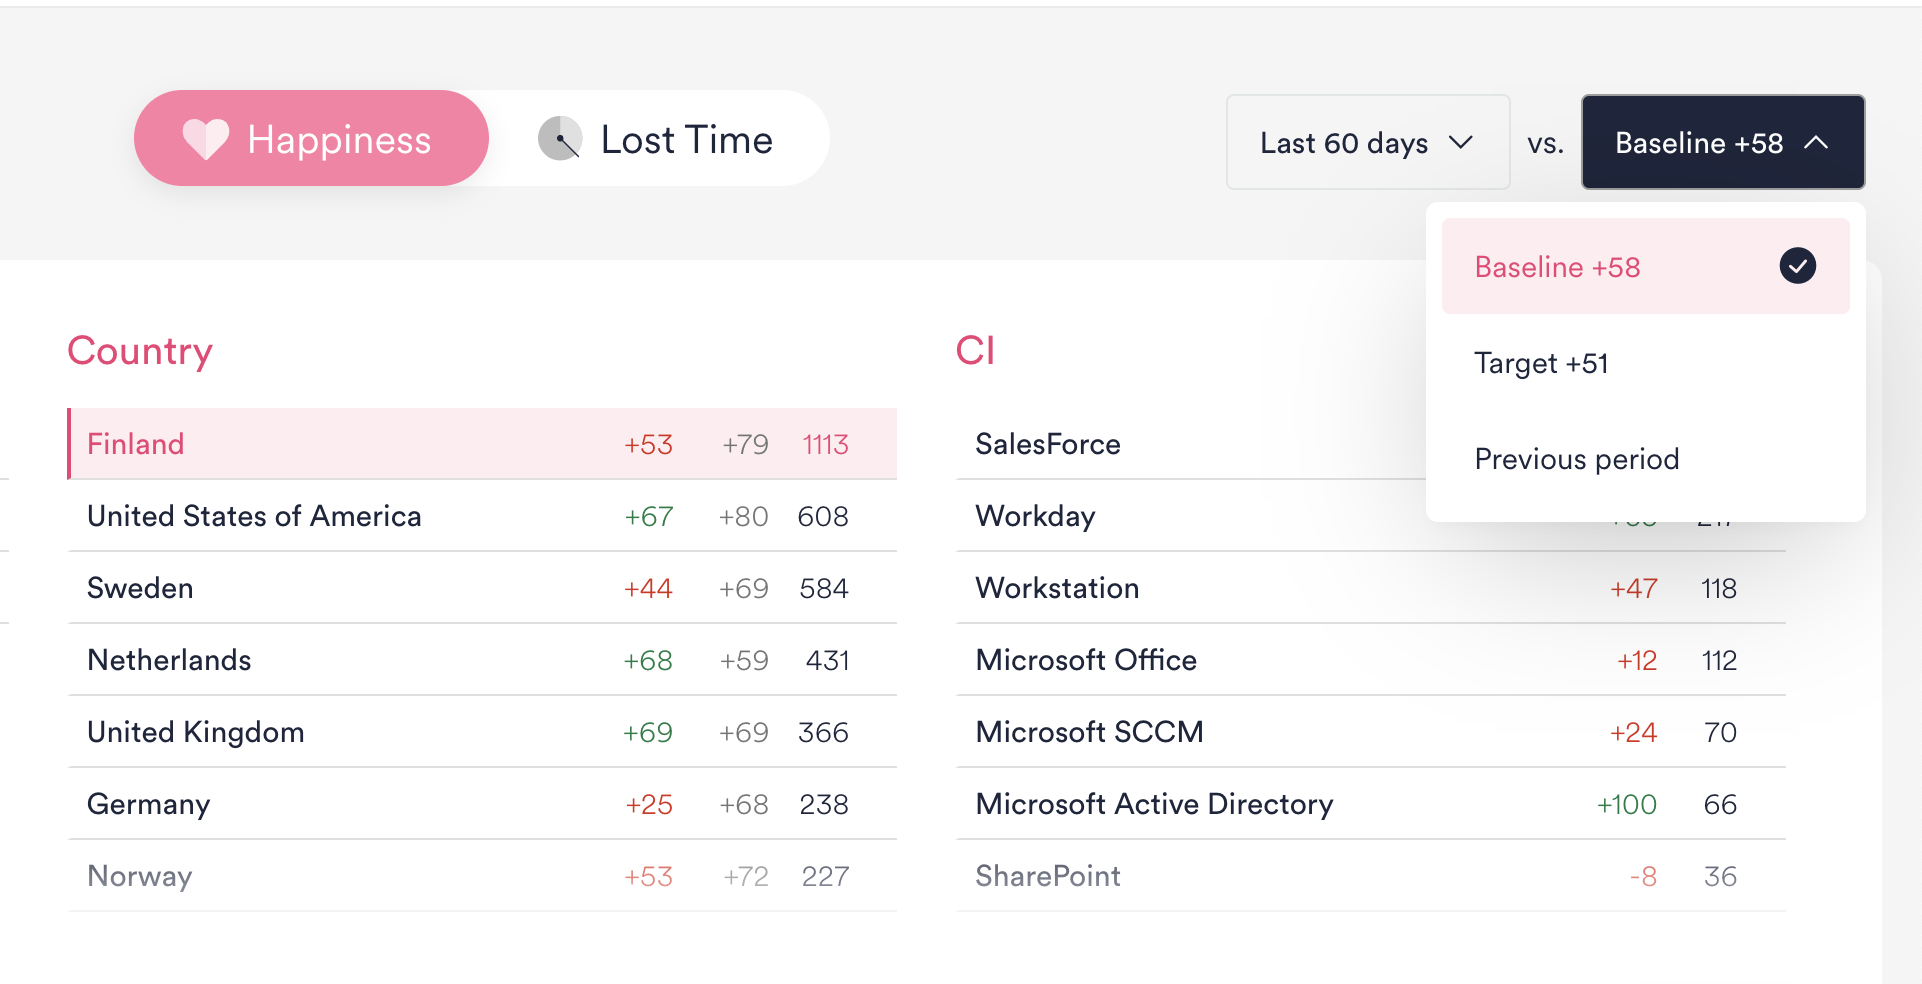
- Compare to your Organization Baseline: You can now compare Happiness / Lost Time in specific IT areas to the Baseline for your entire organization. All data on the Experience page will be colored green if it's above Baseline, or red if it's below. The main graph also shows when experience was above or below Baseline over time.
Your Baseline is calculated from all responses for that Measurement Area and/or the selected ticket type (if any) in your organization during the selected time period – e.g. All Incidents, All Remote Work.
For MSPs and GSIs, this new feature helps you to compare Happiness / Lost Time with the baseline for each client.
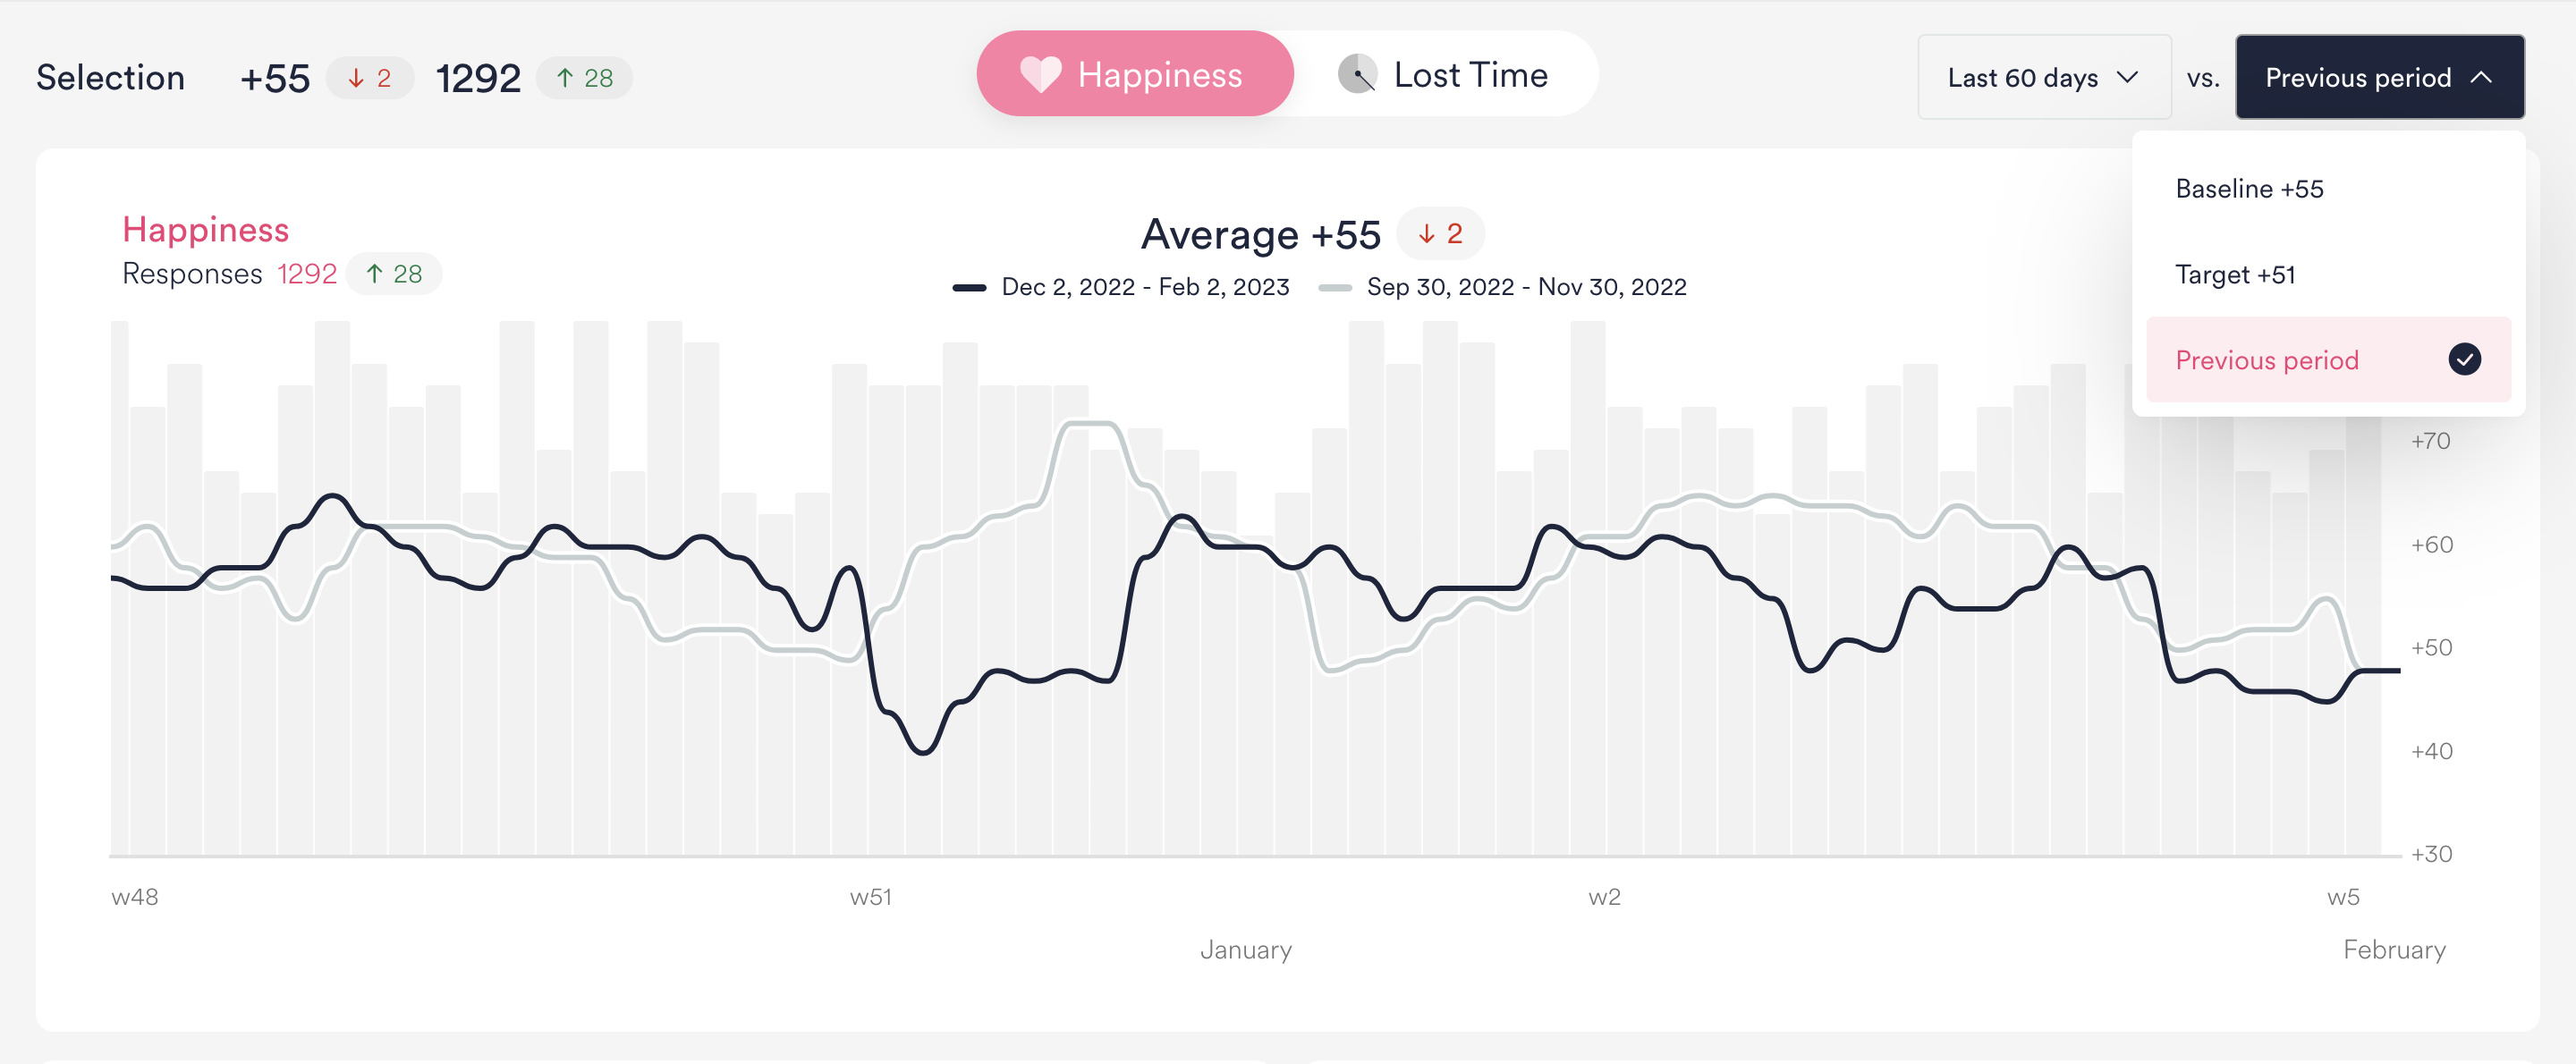
- Compare to Previous Period: See how experience has changed compared to the equivalent time period before the one you're looking at – e.g. "Last 60 days" vs. the 60 days before that.
This new feature makes it easy to do, for instance, month-on-month, quarter-on-quarter, or year-on-year comparisons straight from the Experience page.
Identify onboarding changes and pain points
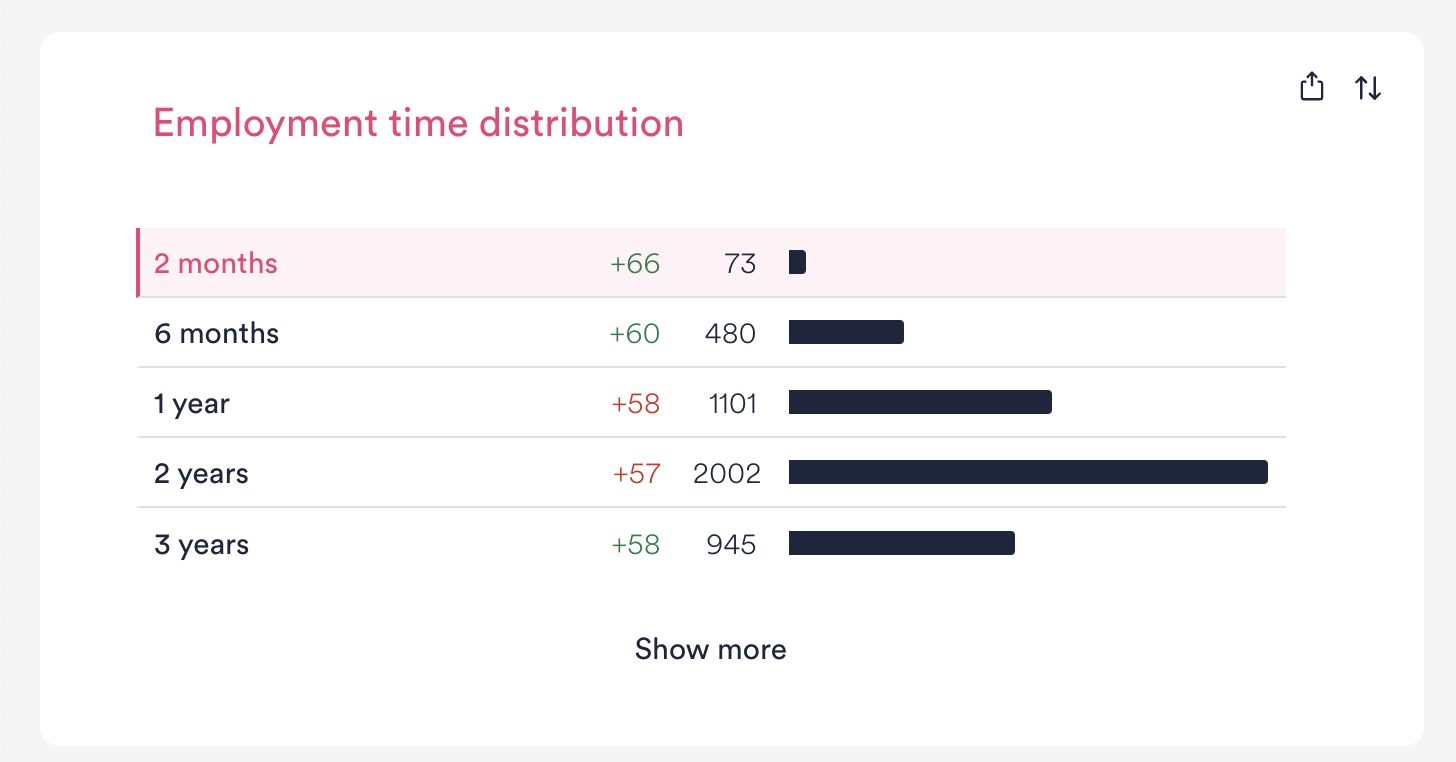
- Employment Time Graph: Identify onboarding pain points and changes across employee cohorts. Use the '2 months' filter to drill down into response data from employees who have been at your organization for 2 months or less, to find out where new joiners are having poor experiences.
Customize the Experience page for your needs
-
Top categories fill page width dynamically, even if there are fewer than four: We've made it easier to customize your Experience page view. If you wish to see fewer than four data categories at the top, Admins can go to Settings>Filters to configure the selections for your organization. The remaining categories will now expand to fill the page width.
Note: Only Admin users can change the Top 4 categories in Settings. Changes will apply to the Experience page view for all users in your organization.
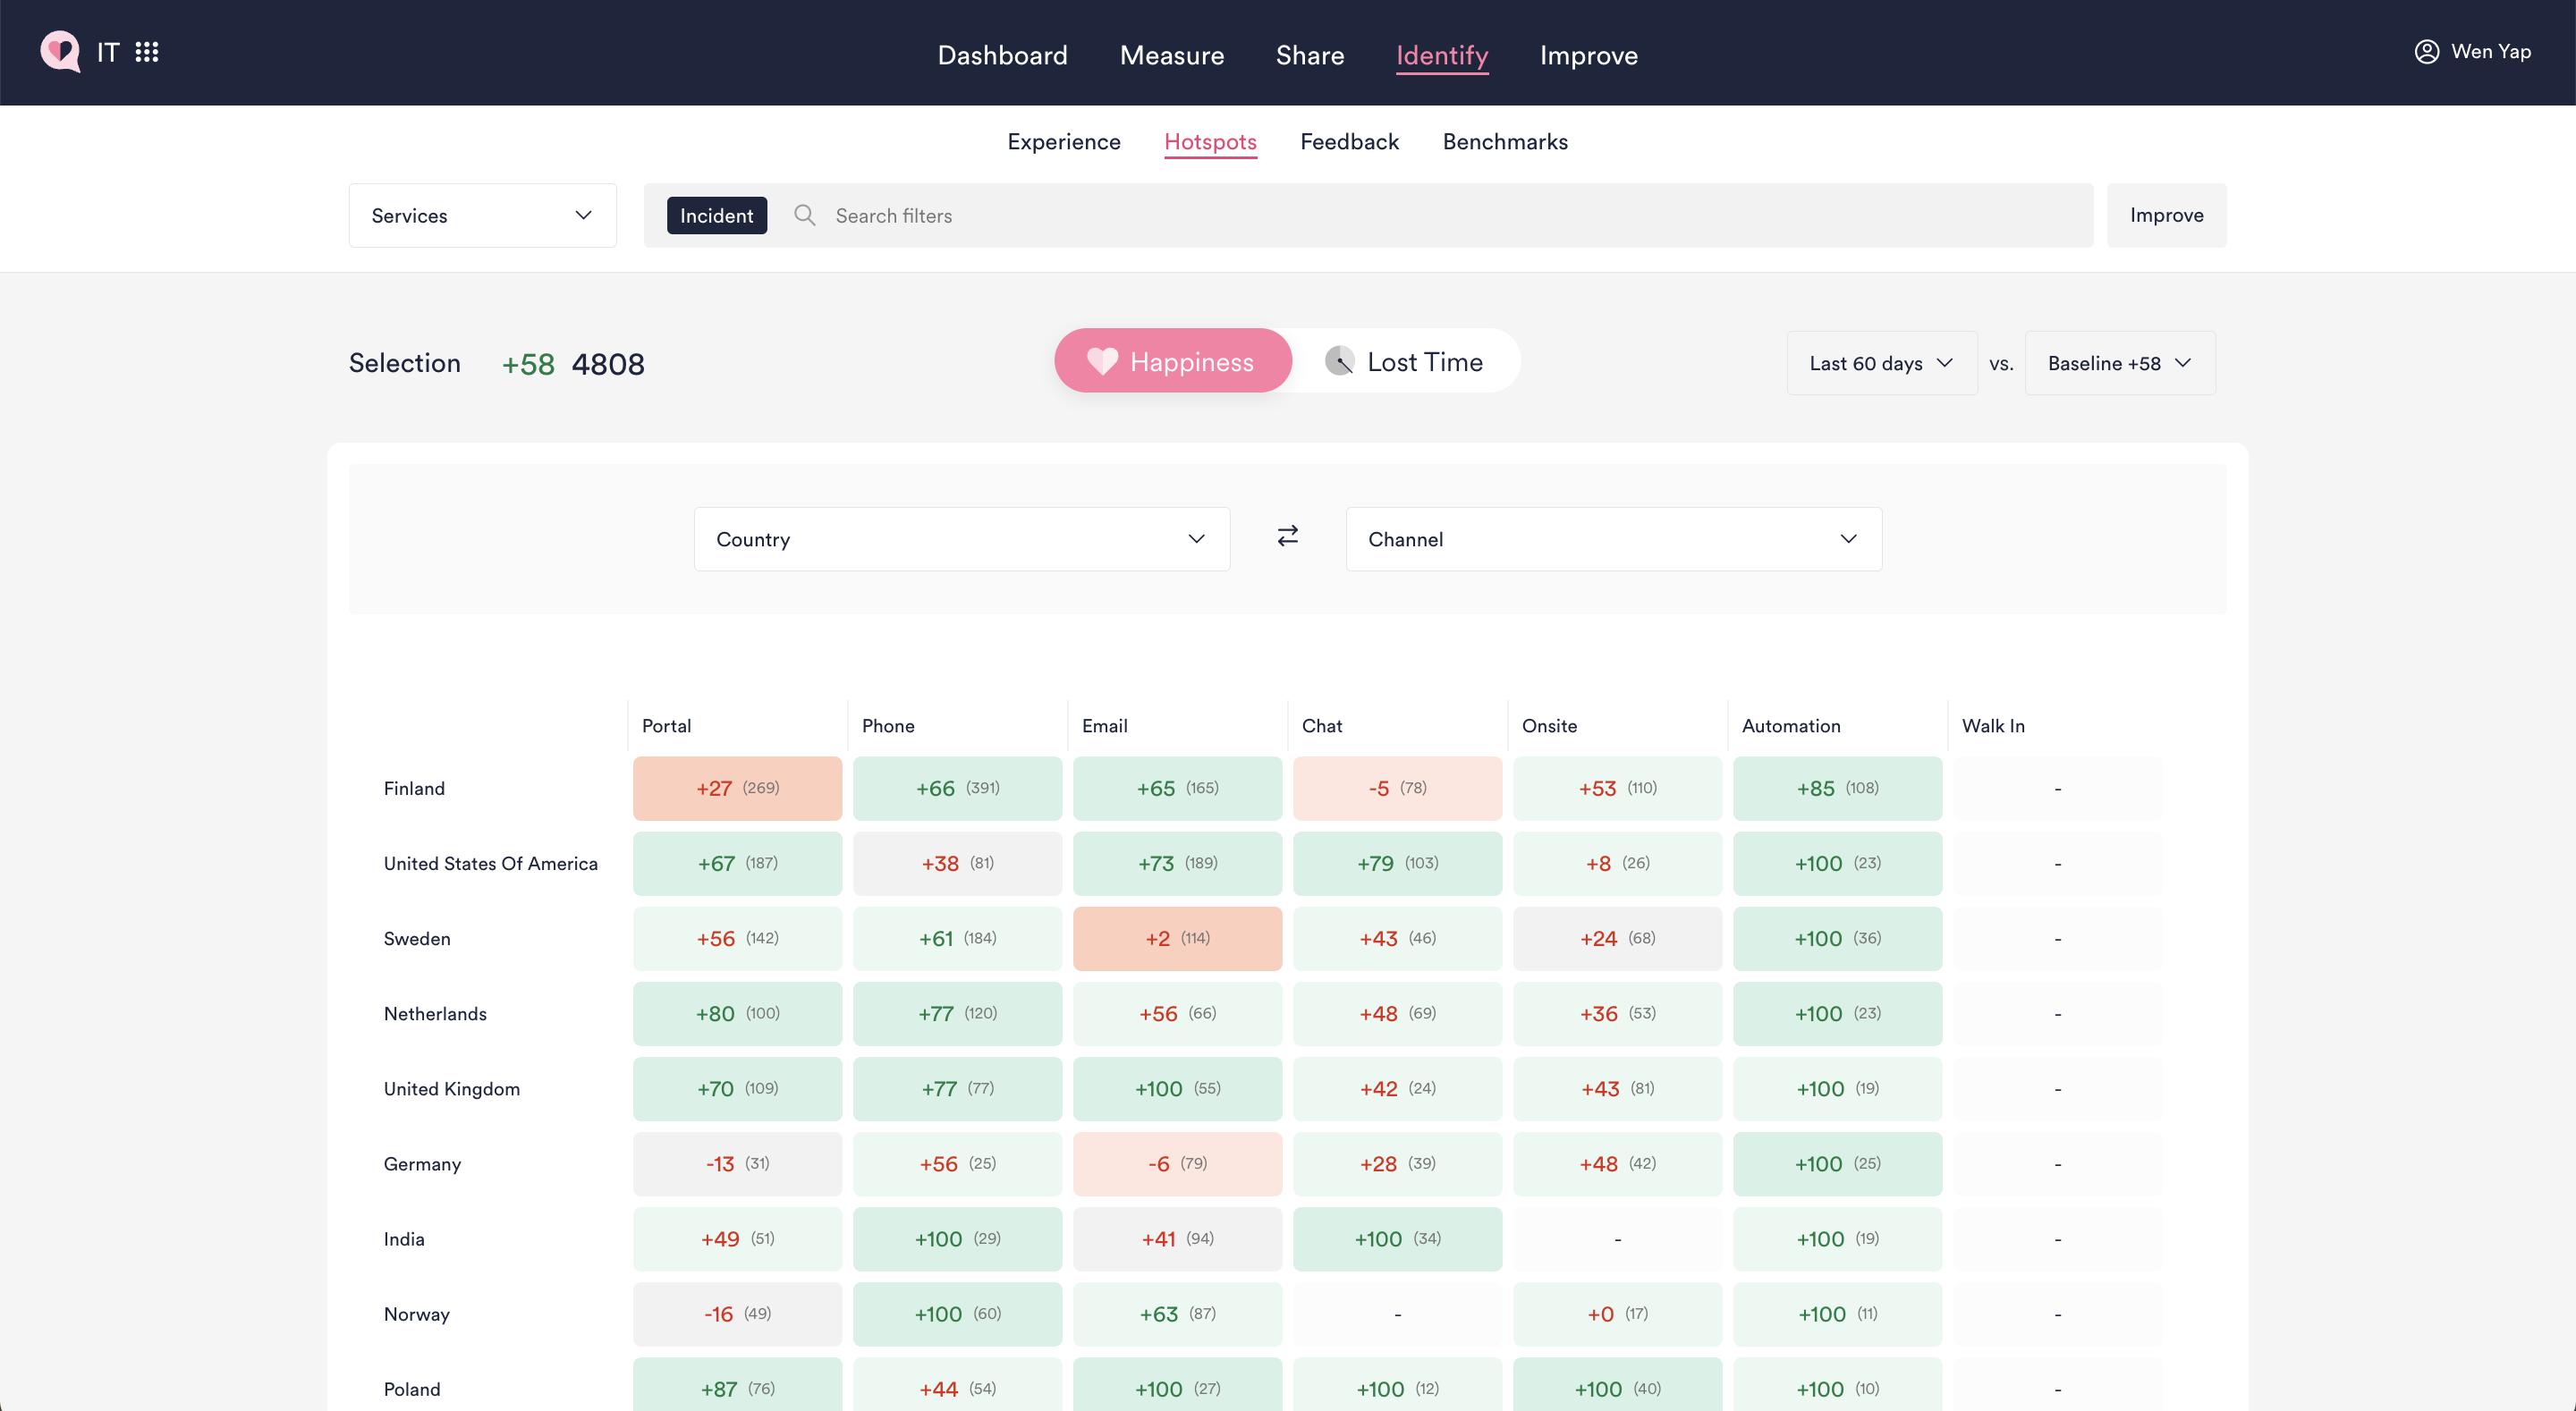
New Hotspots page to identify experience hot spots
Other than renaming the Reports page to Experience, we've also added a new Hotspots page for exposing experience gaps.
- Create heat maps: View data across two data categories to expose experience gaps, e.g. Country and Channel, or Location and Service.
The areas highlighted in dark red have both high response volume (many affected end-users) and a large negative difference in Happiness / Lost Time compared to Baseline, Previous period, or Target – depending on what you've selected. In the example below, Portal in Finland seems to be an area to focus on improving.
Platform performance enhancements 🤖
- Better performance and speed: We've made infrastructural upgrades to enhance performance and speed on the HappySignals Platform. These enhancements will especially benefit customers with large amounts of data.