New 🎉
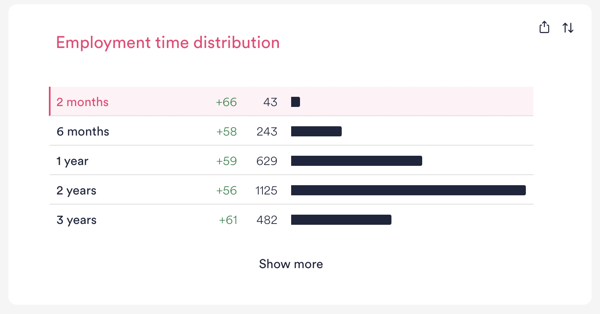
- Employment Time graph (Experimental Feature*):
Understand how experience changes based on employees' employment time in your organization. Use this new graph on the Reports page to filter and drill down into the rest of your operational and experience data.
*Activate this new feature by clicking on your user avatar > Experimental Features
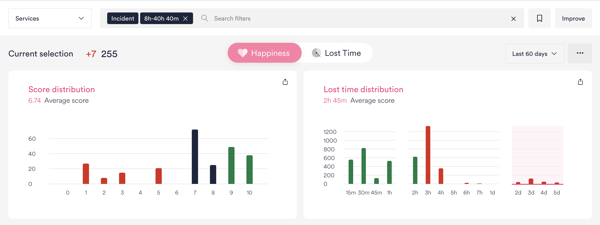
- Key metrics visible from anywhere on Reports page: Always see Happiness/Lost Time and Volume numbers on the top left of Reports, no matter where you are on the page. Now you can easily refer to key experience metrics, even when adding or removing filters.
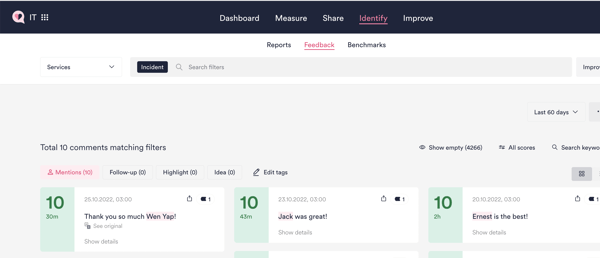
- Names in comments highlighted: Names mentioned in free text comments are now highlighted on the Feedback page.
Bugs 🐞
- Minor bug fixes