Try out Experimental Features and tell us what you think!
We regularly roll out the latest developing features at HappySignals Labs as Experimental Features for customers to optionally enable and try out. By doing so, we can test and refine each new feature with real users before it is product-ready.
HappySignals values your feedback very much. We encourage users who enable Experimental Features to tell us what you think about them via the in-platform feedback tool, so we know how to improve.
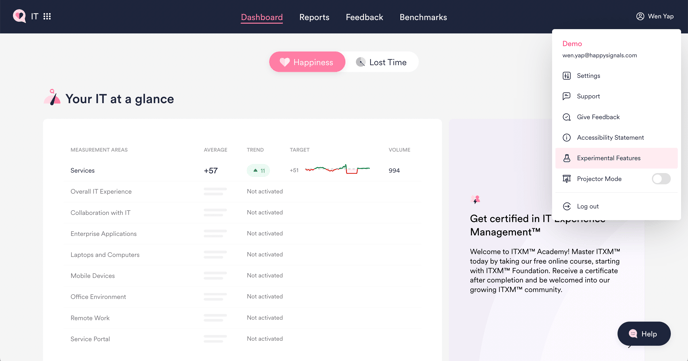
You can open the Experimental Features modal from the user menu in the top right corner.
Enable the features by switching them on. After you've tried them out, you can give feedback about them from the same modal.
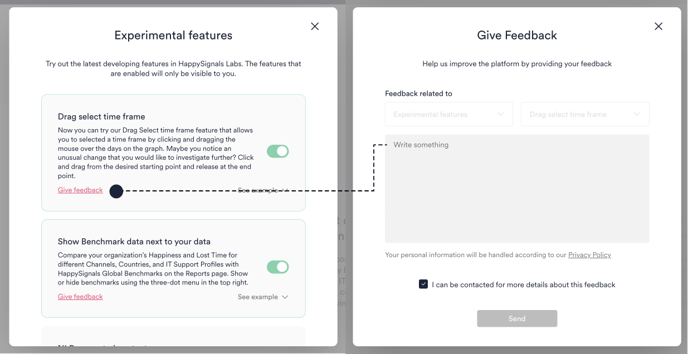
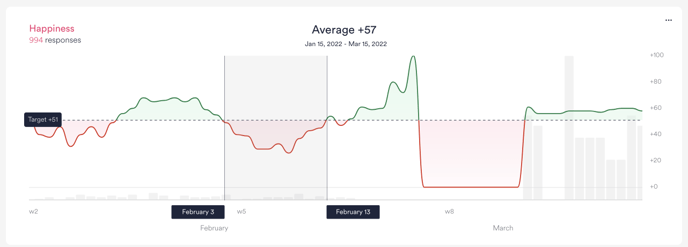
Experimental Feature: Drag select time frame
Enable and try out our new Drag Select time frame experimental feature, which allows you to effortlessly select and zoom into a specific time frame in your data.
Maybe you noticed an unusual change in Happiness or Lost Time over a certain time that you would like to investigate further? Click and drag from your desired starting point to end point on the graph in the Reports page to zoom in to the response data during that time frame. Now, you can drill down and identify what happened there!
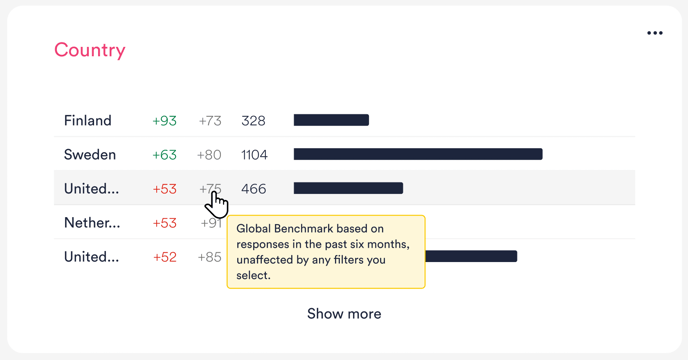
Experimental Feature: Show benchmark data next to your data
Enable and try out this feature to compare your organization’s Happiness and Lost Time for different Channels, Countries, and IT Support Profiles with HappySignals Benchmarks on the Reports page. Our global benchmarks are calculated based on end-user responses in the past six months from all HappySignals customers.
The benchmark numbers are shown next to your organization's numbers, so you can easily compare how your organization is doing relative to other organizations in each area.
NOTE! Your organization's numbers are still color-coded based on your Happiness or Lost Time targets, not the benchmark. i.e. Green = better than your target, Red = worse than your target.